IB Chemistry Study Summary

Thermodynamics

1
Enthalpy Change Context
Diagram

Measuring Enthalpy Changes in Reactions

The energy absorbed or released during a chemical reaction, known as the enthalpy change, can be physically measured. This measurement often involves observing the temperature change in a surrounding medium, typically water, which acts as a calorimeter.

Calorimetry and Energy Transfer

Consider a scenario where food is burned; this combustion represents a chemical reaction. The energy released by this reaction is transferred to a known mass of water, causing its temperature to rise. By carefully measuring this temperature change in the water, we can quantify the amount of energy given off by the burning food.
Diagram

Calculating Enthalpy Change from Temperature Data

The enthalpy change of a reaction is directly calculated from the observed temperature change of a known mass of water. This principle forms the basis of calorimetry. The specific heat capacity of water, a known constant, allows us to relate the temperature change to the total energy transferred.
Diagram

Understanding Enthalpy Change

Enthalpy change (ΔH) is a fundamental thermodynamic property that quantifies the heat absorbed or released by a system at constant pressure. A negative ΔH indicates an exothermic reaction, where heat is released to the surroundings, while a positive ΔH signifies an endothermic reaction, where heat is absorbed from the surroundings.
2
Calorimetry & Specific Heat

Understanding Specific Heat Capacity and Standard Conditions

Specific heat capacity is a fundamental property of a substance that quantifies the amount of heat energy required to raise the temperature of one unit mass of that substance by one degree Celsius or one Kelvin. This value is crucial for calculating enthalpy changes in various chemical processes. When measuring enthalpy changes, it is important to define a standard state to ensure comparability of results. The standard state for thermodynamic measurements is defined at standard ambient temperature and pressure (SATP), which corresponds to 100 kPa (100,000 Pa) and 25 °C (298 K). It is important to note that standard conditions and the specific heat capacity of water are typically provided in data booklets for reference. For practical calculations, the density of water is often approximated as 1 g/cm3, meaning 1 gram of water occupies 1 cm3. However, it is crucial to remember that this approximation is specific to water and not applicable to all liquids.

Calculating Enthalpy Change from Calorimetry Data

Calorimetry experiments are designed to measure the heat absorbed or released during a chemical reaction. Consider an example where a student investigates the enthalpy change when butan-1-ol is combusted. In this experiment, the heat produced by the burning butan-1-ol is absorbed by a known mass of water, leading to a measurable temperature increase. Let's analyze a specific scenario: A student observes that the temperature of 175 g of water increases by 8.0 °C when 5.00 x 10⁻³ mol of pure butan-1-ol is burned. To calculate the enthalpy change of combustion in kJ mol–1, we need to use the specific heat capacity of water, which is 4.18 J K–1 g–1. The relevant information extracted from the problem statement includes:
  • Mass of water (m) = 175 g
  • Specific heat capacity of water (c) = 4.18 J K–1 g–1
  • Change in temperature (ΔT) = 8.0 K (since a change of 8.0 °C is equivalent to a change of 8.0 K)
The heat absorbed by the water (qwater) can be calculated using the formula q = mcΔT.
qwater = 175 g × 4.18 J K–1 g–1 × 8.0 K = 5852 J.
This value can be converted to kilojoules: 5852 J = 5.852 kJ. In a calorimetry experiment, the heat released by an exothermic reaction (ΔHrxn) is absorbed by the surrounding water.
Therefore, the heat released by the reaction is equal in magnitude but opposite in sign to the heat absorbed by the water: ΔHrxn = -ΔHwater.
So, the heat released by the combustion of 5.00 x 10⁻³ mol of butan-1-ol is -5.852 kJ.
To find the enthalpy change per mole (ΔHcombustion), we divide the heat released by the number of moles of butan-1-ol burned:
ΔHcombustion = -5.852 kJ / (5.00 x 10⁻³ mol) = -1170.4 kJ mol–1.

Determining Enthalpy Change in Solution Reactions

Calorimetry can also be used to determine the enthalpy change of reactions occurring in solution, such as neutralization reactions. Consider the reaction between sodium hydroxide and hydrochloric acid. Let's calculate the standard molar enthalpy of neutralization for the reaction between 50.0 cm3 of 1.0 mol dm-3 NaOH(aq) and 50.0 cm3 of 1.0 mol dm-3 HCl(aq). The reaction takes place in a calorimeter, and the temperature of the mixture rises from 18.0 °C to 24.6 °C. The specific heat capacity of water is 4.18 J K–1 g–1.
First, we need to determine the total mass of the solution. Assuming the density of the solution is similar to water (1 cm3 = 1 g), the total mass (m) is the sum of the volumes: m = 50.0 cm3 + 50.0 cm3 = 100.0 cm3 = 100.0 g.
Next, calculate the change in temperature (ΔT): ΔT = 24.6 °C - 18.0 °C = 6.6 °C, which is equivalent to 6.6 K. Now, calculate the heat absorbed by the solution (q) using the formula q = mcΔT:
q = 100.0 g × 4.18 J K–1 g–1 × 6.6 K = 2758.8 J.
Converting this to kilojoules: q = 2.7588 kJ. To find the molar enthalpy of neutralization, we need to determine the number of moles (n) of reactant involved. For both NaOH and HCl, the number of moles is: n = Concentration × Volume = 1.0 mol dm-3 × 0.050 dm3 = 0.050 mol.
Finally, the standard molar enthalpy of neutralization (ΔH0n) is calculated by dividing the heat absorbed by the number of moles, and since it's an exothermic reaction (temperature increased), the sign is negative: ΔH0n = - (q / n) = - (2.7588 kJ / 0.050 mol) = -55.176 kJ mol-1.
Rounding to an appropriate number of significant figures, ΔH0n = -55.18 kJ mol-1.
3
Heat Loss & Uncertainty
Diagram

Reliability of Experimental Data in Calorimetry

Experiments designed to investigate endothermic and exothermic processes should ideally be conducted multiple times. This repetition allows for a comparison of the reliability and consistency of the data obtained, and also facilitates a more robust comparison with theoretical values. Reliable data is crucial for drawing accurate conclusions about the enthalpy changes involved in chemical reactions.
Diagram

Minimizing Heat Loss in Solution Reactions

When performing calorimetry experiments, particularly for reactions occurring in solution, minimizing heat loss to the surroundings is paramount for accurate enthalpy measurements. The polystyrene beaker method is a common and effective technique to reduce heat loss because polystyrene acts as a good thermal insulator. This helps to ensure that the heat generated or absorbed by the reaction is primarily contained within the system being studied.
Diagram

Impact of Unaccounted Heat Loss on Enthalpy Measurements

Despite using insulating materials like polystyrene, some heat loss to the surroundings can still occur. If heat is lost from an exothermic reaction to the environment, the measured temperature change (ΔT) will be lower than the actual temperature change, leading to an underestimation of the enthalpy change (ΔH). Conversely, if an endothermic reaction absorbs heat from the surroundings, the measured ΔT will be smaller, again leading to an underestimation of the magnitude of ΔH. Therefore, unaccounted heat loss consistently leads to less accurate enthalpy measurements.

Accounting for Heat Loss Using Cooling Curves

To obtain the most accurate estimate of the temperature change (ΔT) in a calorimetry experiment, especially when heat loss is a factor, a cooling curve can be employed. This method involves recording temperature readings over time, both before and after the reaction, and then extrapolating to determine the theoretical maximum or minimum temperature that would have been reached in the absence of heat exchange with the surroundings. This approach helps to correct for the heat lost or gained during the experimental procedure, leading to a more reliable ΔT value.
Diagram

Sources of Uncertainty in Calorimetry Experiments

Calorimetry experiments are subject to various sources of uncertainty that can affect the precision and accuracy of the results. Key uncertainties typically arise from:
  • Temperature measurements: The precision of the thermometer and the ability to read it accurately contribute to uncertainty.
  • Volume or mass of water: Inaccuracies in measuring the volume or mass of the solvent (usually water) directly impact the calculation of heat absorbed or released.
  • Volume or mass of reactants: The precision with which reactants are measured affects the stoichiometry and thus the calculated enthalpy change per mole.
Quantifying these uncertainties is essential for evaluating the overall reliability of the experimental data.

Quantifying Uncertainty in Temperature Measurements

When considering a calorimetry experiment, such as measuring the enthalpy change when 1 mol dm-3 NaOH is mixed with 1 mol dm-3 HCl, the uncertainty associated with temperature measurements is a critical factor. For an analog thermometer, the absolute uncertainty is typically half the smallest division. For a digital thermometer, it is often taken as ±0.1 °C. For example, if a temperature is measured as 25.6 °C, it should be reported as T = 25.6 ± 0.1 °C. This notation indicates that the true temperature lies between 25.5 °C and 25.7 °C, with ±0.1 °C representing the absolute uncertainty. To express this as a percentage uncertainty, the absolute uncertainty is divided by the measured value and multiplied by 100: (0.1 / 25.6) × 100 = 0.39%.

Error Propagation in Calorimetry Calculations

When calculating the temperature change (ΔT), which involves two temperature measurements (initial and final), each measurement carries its own uncertainty. For instance, if the initial temperature is 19.0 °C and the final temperature is 25.6 °C, then ΔT = 25.6 - 19.0 = 6.6 °C. When measurements are added or subtracted, their absolute uncertainties are added. Therefore, if each temperature measurement has an absolute uncertainty of ±0.1 °C, then ΔT = 6.6 ± (0.1 + 0.1) °C = 6.6 ± 0.2 °C. This absolute uncertainty can also be expressed as a percentage uncertainty: (0.2 / 6.6) × 100 = 3.03%. Conversely, when measurements are multiplied or divided, their percentage uncertainties are added to determine the percentage uncertainty of the final result.
4
Enthalpy Fundamentals

Distinguishing Energy and Heat

Energy is defined as the capacity to perform work and manifests in various forms, including heat, light, sound, electricity, and chemical energy. In contrast, heat is a specific mechanism of energy transfer that occurs due to temperature differences between objects or systems. This transfer of heat energy leads to an increase in the average kinetic energy of the particles within a substance, consequently increasing their disorder. Chemical reactions frequently involve the absorption or release of energy, often in the form of heat.

Defining System and Surroundings in Energy Transfer

When analyzing energy transfers, it is crucial to clearly delineate the "system" from its "surroundings." The system refers to the specific area of interest where the chemical or physical change is occurring, while the surroundings encompass everything else in the universe outside of this defined system. Most chemical reactions encountered in everyday life occur in open systems, which are capable of exchanging both energy and matter with their surroundings. Conversely, closed systems allow for the exchange of energy but prevent the transfer of matter. It is a fundamental principle that the total energy of the universe remains constant during any chemical reaction, adhering to the law of conservation of energy.

Understanding Enthalpy and Enthalpy Changes

Enthalpy (H) represents the total heat content of a system. Changes in enthalpy, denoted as ΔH, are critical indicators of energy flow during a process. A positive ΔH signifies that heat has been absorbed by the system from its surroundings, indicating an endothermic process. Conversely, a negative ΔH indicates that heat has been released from the system into the surroundings, characterizing an exothermic process.
Diagram

Differentiating Endothermic and Exothermic Reactions

Chemical reactions are categorized as either endothermic or exothermic based on their enthalpy change. Exothermic reactions are those where the system releases heat to the surroundings, resulting in a negative enthalpy change (ΔH < 0). Conversely, endothermic reactions are processes where the system absorbs heat from the surroundings, leading to a positive enthalpy change (ΔH > 0).
Diagram

Standard Enthalpy Changes and Conditions

The standard enthalpy change, denoted as ΔH⦵, refers to the enthalpy change of a reaction measured under a specific set of standard conditions. These conditions are defined as: a pressure of 100 kPa, a concentration of 1 mol dm-3 for all solutions, and all substances being in their standard states. The standard state of a substance is its pure form at 298 K (25 °C) and 100 kPa.

Interpreting Thermochemical Equations

Thermochemical equations are chemical equations that include the enthalpy change (ΔH⦵) for the reaction, providing information about the energy absorbed or released. For example, the combustion of methane can be represented as CH4(g) + 2O2(g) → CO2(g) + 2H2O(l) with ΔH⦵ = -890 kJ mol-1. The negative sign indicates that this is an exothermic reaction, releasing 890 kJ of energy per mole of methane combusted. In contrast, the photosynthesis reaction, 6CO2(g) + 6H2O(l) → C6H12O6(aq) + 6O2(g), has a ΔH⦵ = +2802.5 kJ mol-1. The positive sign signifies that this is an endothermic reaction, requiring the input of 2802.5 kJ of energy per mole of glucose produced. Therefore, a ΔH < 0 always indicates an exothermic process, while a ΔH > 0 signifies an endothermic process.
5
Hess's Law

Understanding Hess's Law

Hess's Law is a fundamental principle in thermochemistry that allows for the calculation of enthalpy changes (ΔH) for reactions that cannot be measured directly. This law states that the total enthalpy change for a chemical reaction is independent of the pathway taken, meaning that whether a reaction occurs in one step or a series of steps, the overall enthalpy change remains the same. This principle is a direct consequence of the Law of Conservation of Energy.

Consider the formation of ethanol from its constituent elements and its subsequent combustion. The "clockwise route" involves combining elements to form ethanol, which is then burned. Alternatively, the "anticlockwise route" involves burning the elements separately. Hess's Law dictates that the total enthalpy change for both routes will be identical.

Illustrating Hess's Law with Combustion

Let's visualize Hess's Law using a specific example involving combustion reactions. Imagine we want to determine the enthalpy change for a reaction that is difficult to measure directly. We can achieve this by using a series of known reactions that, when combined, yield the target reaction.

Diagram

The Law of Conservation of Energy and Hess's Law

According to the Law of Conservation of Energy, the total enthalpy change for a reaction must be consistent regardless of the path taken. If we consider a scenario where ΔH1 represents the enthalpy change for one step and ΔH2 for another, and ΔH3 represents the direct path, then ΔH1 + ΔH2 must equal ΔH3. This holds true even if the reaction involves multiple intermediate stages, as the overall enthalpy change is simply the sum of all individual changes.

Diagram
Diagram
Diagram

Applying Hess's Law with Energy Level Diagrams

Energy level diagrams are useful tools for visualizing the relationships between different reactions and their enthalpy changes. For instance, if the enthalpy change for a reaction (ΔH1) cannot be measured directly, it can often be calculated indirectly. This is achieved by utilizing the known standard enthalpy changes of combustion (ΔHc) for the reactants and products, such as carbon, hydrogen, and propane, and constructing a Hess cycle.

Diagram
Diagram

Example Application of Hess's Law

Let's consider a practical example of how Hess's Law is applied to calculate an unknown enthalpy change.

Solving Hess's Law Problems

Diagram

To calculate the enthalpy change, ΔH, for the dimerization of nitrogen dioxide, 2NO2(g) → N2O4(g), we can use the provided standard enthalpy changes of formation:

Diagram
  • ½N2(g) + O2(g) → NO2(g) ΔH = +33.2 kJ mol-1
  • N2(g) + 2O2(g) → N2O4(g) ΔH = +9.16 kJ mol-1

                                                                          The strategy involves manipulating the given equations so                                                                                that when they are added together, they yield the target                                                                                      equation. This may involve reversing equations (which                                                                                        changes the sign of ΔH) and multiplying or dividing                                                                                        equations by a coefficient (which scales ΔH accordingly).

                                                                          To obtain 2NO2(g) on the reactant side, we reverse the first                                                                              equation and multiply it by 2:

                                                                       
2[NO2(g) → ½N2(g) + O2(g)] ΔH = 2(-33.2 kJ mol-1) = -66.4 kJ mol-1

The second equation, N2(g) + 2O2(g) → N2O4(g), already has N2O4(g) on the product side, so we keep it as is:

N2(g) + 2O2(g) → N2O4(g) ΔH = +9.16 kJ mol-1

Now, we add the manipulated equations and their corresponding enthalpy changes:

2NO2(g) + N2(g) + 2O2(g) → N2(g) + 2O2(g) + N2O4(g)

The N2(g) and 2O2(g) terms cancel out from both sides, leaving the target equation:

2NO2(g) → N2O4(g)

The total enthalpy change is the sum of the individual enthalpy changes:

ΔH= (-66.4 kJ mol-1) + (+9.16 kJ mol-1) = -57.24 kJ mol-1

6
Standard Enthalpy of Formation

Defining Standard Enthalpy of Formation

The enthalpy of formation, specifically the standard enthalpy of formation (ΔHf
Diagram
), quantifies the heat change when one mole of a compound is synthesized from its constituent elements. This process must occur under standard conditions, meaning at 298 K (25 °C) and 1 atmosphere of pressure, with all elements present in their most stable physical states. This value provides insight into the thermodynamic stability of a substance relative to its elemental components. Furthermore, standard enthalpies of formation are invaluable for calculating the enthalpy change of virtually any chemical reaction, whether it is a hypothetical pathway or a real-world process. For instance, the standard enthalpy of formation of ethanol can be represented by the following chemical equation: 
Diagram

2C (graphite) + 3H2(g) + ½O2(g) → C2H5OH(l) ΔH = -278 kJ  mol-1
It is important to note that the chemical equation for a standard enthalpy of formation reaction is always balanced to produce exactly one mole of the desired product. This often necessitates the use of fractional stoichiometric coefficients for the reactants. A crucial convention in thermochemistry is that the standard enthalpy of formation (ΔHf) for any pure element in its standard state is defined as zero.

Calculating Enthalpy Changes Using Standard Enthalpies of Formation

The standard enthalpy of formation values are incredibly useful for determining the overall enthalpy change (ΔHrxn) for a chemical reaction. A general principle for calculating reaction enthalpies is to sum the standard enthalpies of formation of the products and subtract the sum of the standard enthalpies of formation of the reactants. This relationship is expressed by the formula:
                                                  ΔHrxn = ∑ΔHf(products) - ∑ΔHf(reactants)
This formula is universally applicable, but it's particularly helpful to consider its application in specific reaction types. For combustion reactions, one might conceptually add the enthalpy changes associated with breaking bonds in reactants and forming bonds in products, which can be related to formation enthalpies. For reactions where compounds are formed from their elements, the direct application of the formula involves subtracting the formation enthalpies of the reactants from those of the products.

Illustrative Problem: Enthalpy Change Calculation

Let's apply the principles of standard enthalpy of formation to calculate the enthalpy change for a specific reaction. Consider the combustion of propane: C3H8(g) + 5O2(g) → 3CO2(g) + 4H2O(g) To calculate the enthalpy change for this reaction, we will use the formula:
ΔHrxn = ∑ΔHf(products) - ∑ΔHf(reactants) First, we need the standard enthalpy of formation values for each substance involved in the reaction. These are provided in the table below:
Substance ΔHf / kJ mol-1
C3H8(g) -105
CO2(g) -394
H2O(l) -286
Now, we can substitute these values into the formula. Remember that the standard enthalpy of formation for O2(g) is 0 kJ mol-1, as it is an element in its standard state.
ΔHrxn = [3 × ΔHf(CO2(g)) + 4 × ΔHf(H2O(g))] - [1 × ΔHf(C3H8(g)) + 5 × ΔHf(O2(g))]
Assuming the ΔHf for H2O(g) is used in the problem context, and not H2O(l) as listed in the table (a common point of confusion, but we will use the provided -286 kJ mol-1 as given in the calculation): ΔHrxn = [3(-394) + 4(-286)] - [(-105) + 5(0)]
ΔHrxn = [-1182 + (-1144)] - [-105]
ΔHrxn = -2326 - (-105) ΔHrxn = -2326 + 105 ΔHrxn = -2221 kJ mol-1
Therefore, the enthalpy change for the combustion of propane under standard conditions is
-2221 kJ mol-1.
7
Bond Enthalpies & Ozone
Diagram

Understanding Bond Enthalpies: Breaking and Forming Bonds

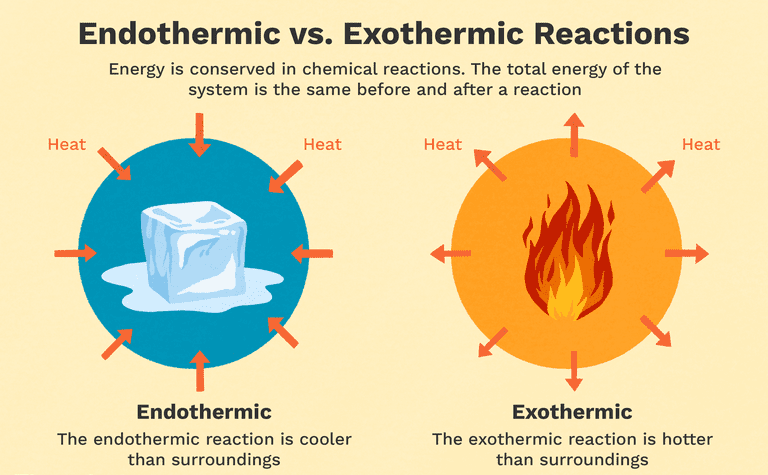
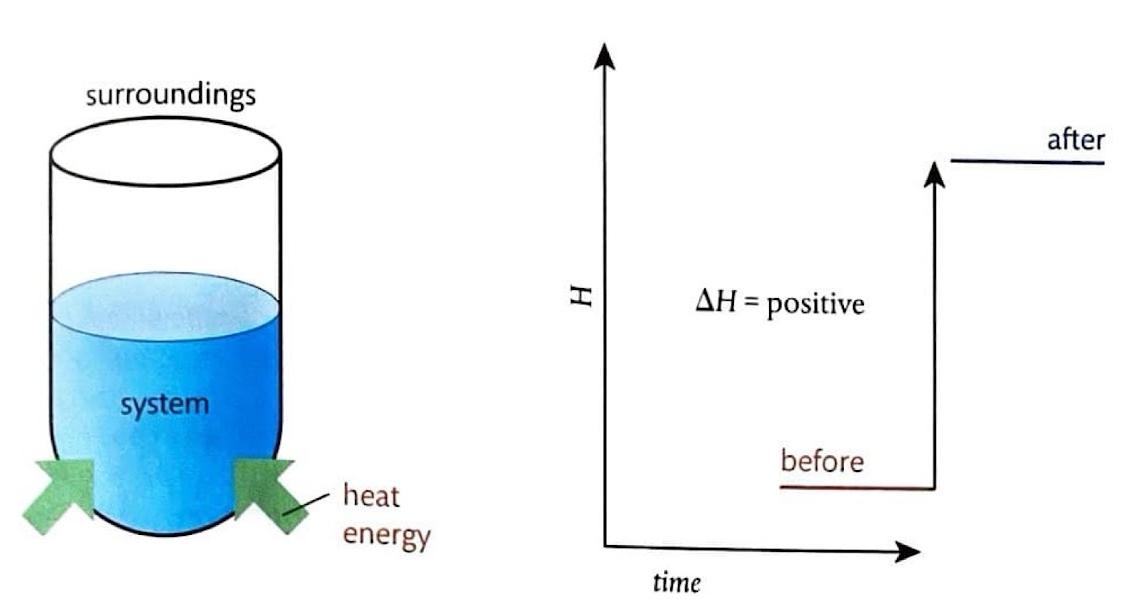
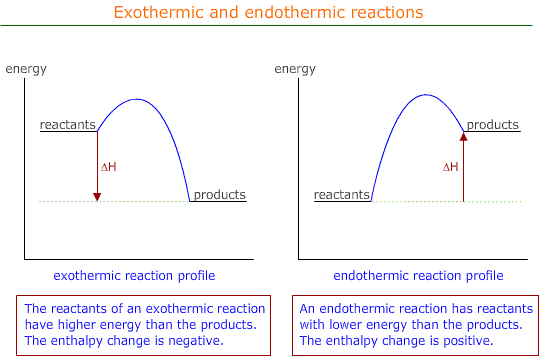
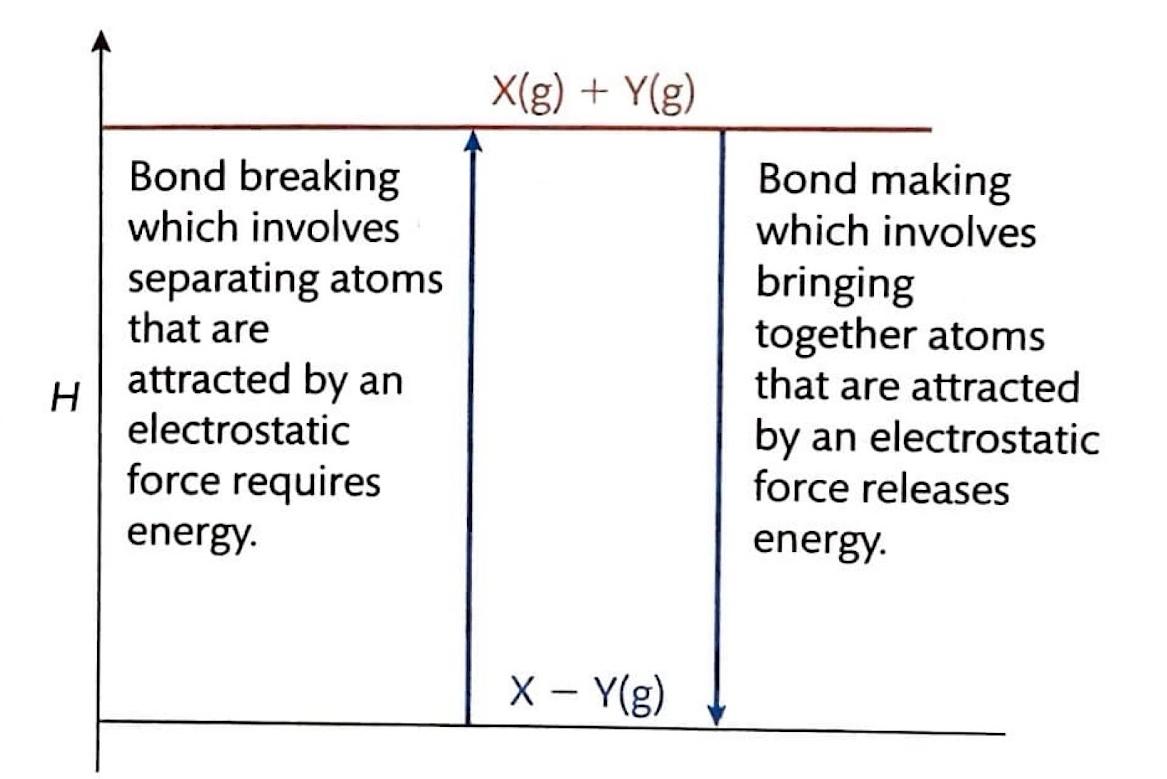
Chemical reactions fundamentally involve the breaking of existing chemical bonds and the formation of new ones. The energy changes associated with these processes are quantified by bond enthalpies. Breaking chemical bonds is an endothermic process, meaning it requires an input of energy from the surroundings. Conversely, the formation of chemical bonds is an exothermic process, releasing energy into the surroundings. For instance, the dissociation of gaseous chlorine molecules into individual chlorine atoms, represented as Cl2(g) → 2Cl(g), has a positive enthalpy change (ΔH° = +242 kJ mol-1), indicating energy absorption. In contrast, the formation of a hydrogen molecule from two gaseous hydrogen atoms, H(g) + H(g) → H2(g), has a negative enthalpy change (ΔH° = -436 kJ mol-1), signifying energy release. The overall enthalpy change of a chemical reaction is determined by the balance between the energy absorbed during bond breaking and the energy released during bond formation. If more energy is released than absorbed, the reaction is overall exothermic.

Defining Average Bond Enthalpy

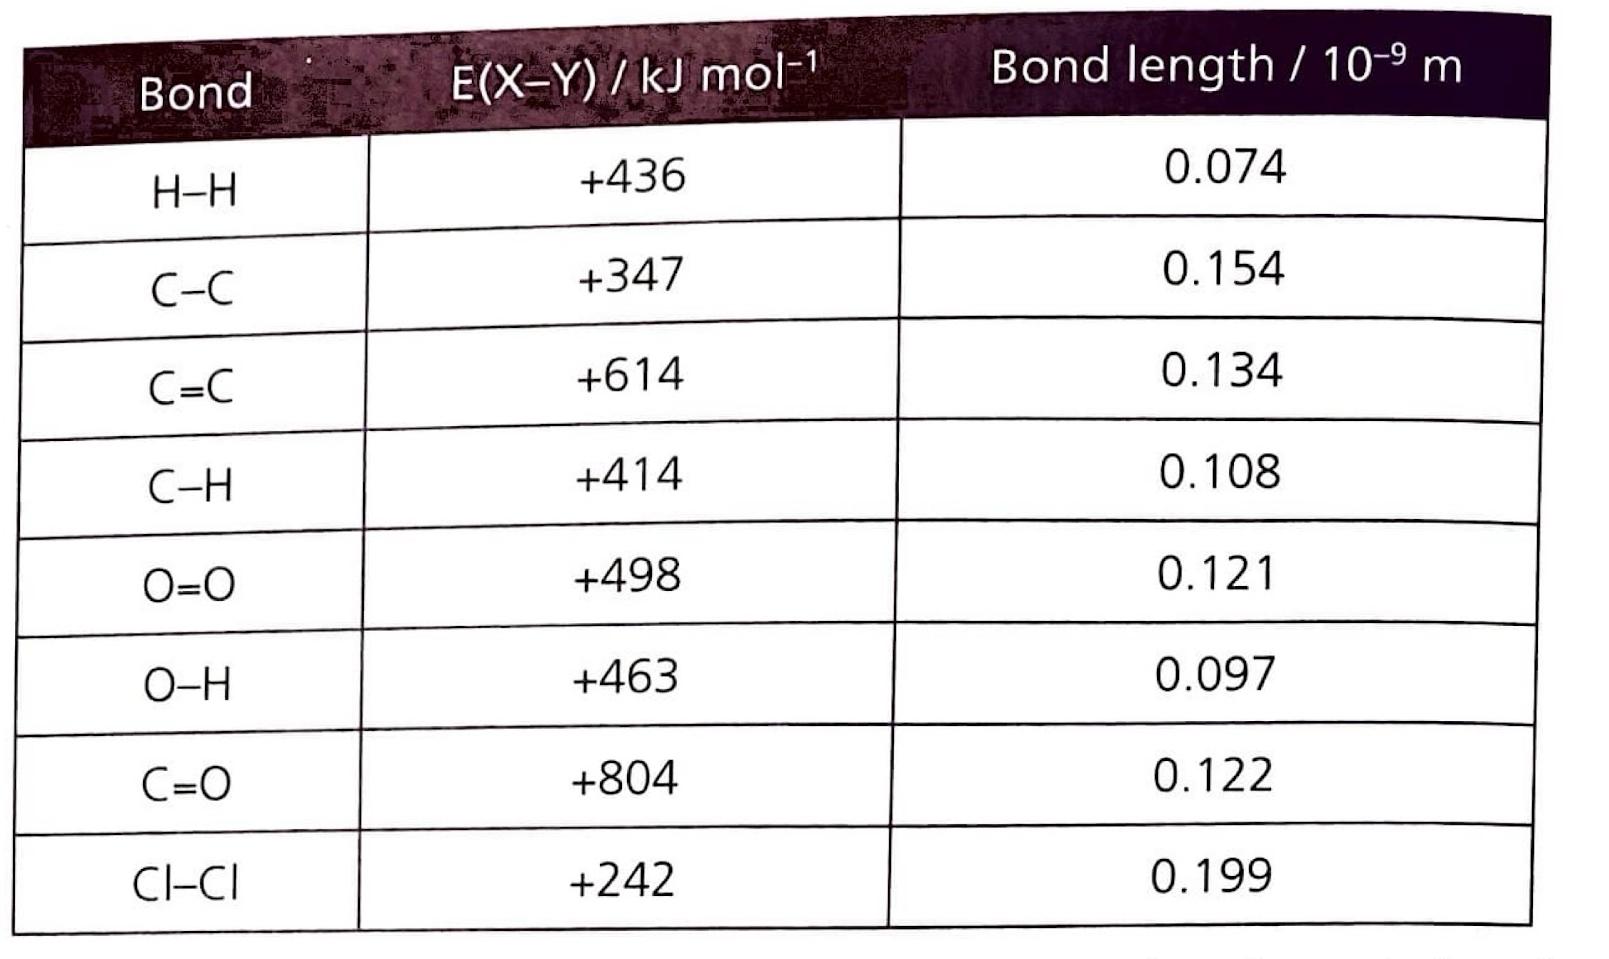
The average bond enthalpy is a crucial concept in thermochemistry. It is defined as the energy required to break one mole of a specific type of bond in gaseous molecules, under standard conditions, averaged over a range of similar compounds. This averaging is necessary because the energy of a particular bond can vary slightly depending on its molecular environment. Generally, multiple bonds, such as double or triple bonds, possess higher bond enthalpies and shorter bond lengths compared to their single bond counterparts, reflecting the greater electrostatic attraction between the bonded atoms.
Diagram

Calculating Enthalpy Change Using Bond Enthalpies

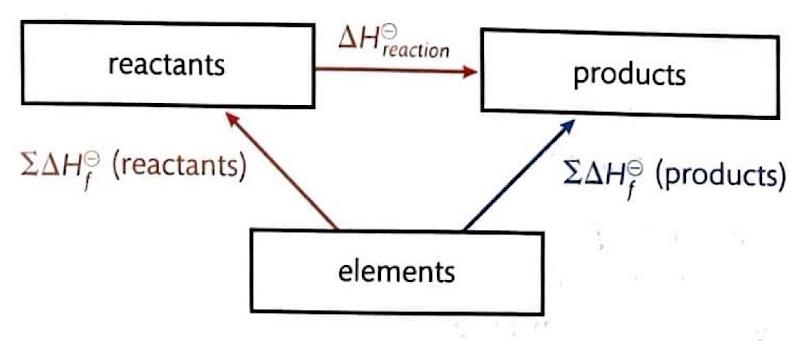
Bond enthalpies can be used to estimate the enthalpy change of a reaction (ΔH°rxn). The principle is that the total energy required to break all bonds in the reactants minus the total energy released when all bonds in the products are formed gives the overall enthalpy change. This can be expressed by the formula:
ΔH°rxn = ΣΔH°(bonds broken) - ΣΔH°(bonds formed).
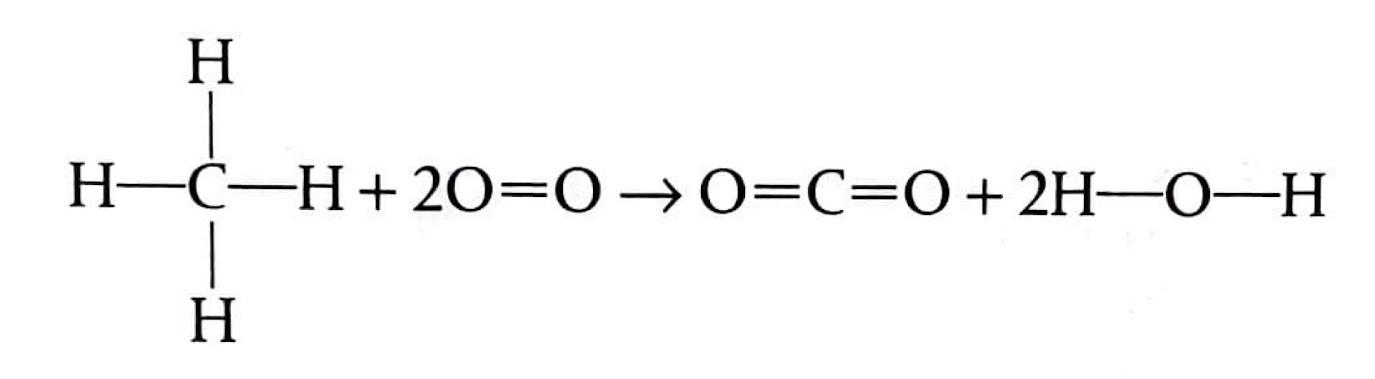
Consider the combustion of methane as an example: CH4(g) + 2O2(g) → CO2(g) + 2H2O(g)
To calculate the enthalpy change, we sum the bond enthalpies of the bonds broken in the reactants and subtract the sum of the bond enthalpies of the bonds formed in the products.
Diagram
Bonds Broken ΔH / kJ mol-1 Bonds formed ΔH / kJ mol-1
4 C-H 4(414) 2 C=O 2(804)
2 O=O 2(498) 4 O-H 4(463)
Total =2652 =3460
Using the formula: ΔH° = ΣΔH°(bonds broken) - ΣΔH°(bonds formed)
ΔH° = 2652 kJ mol-1 - 3460 kJ mol-1
ΔH° = -808 kJ mol-1
This negative value indicates that the combustion of methane is an exothermic reaction.

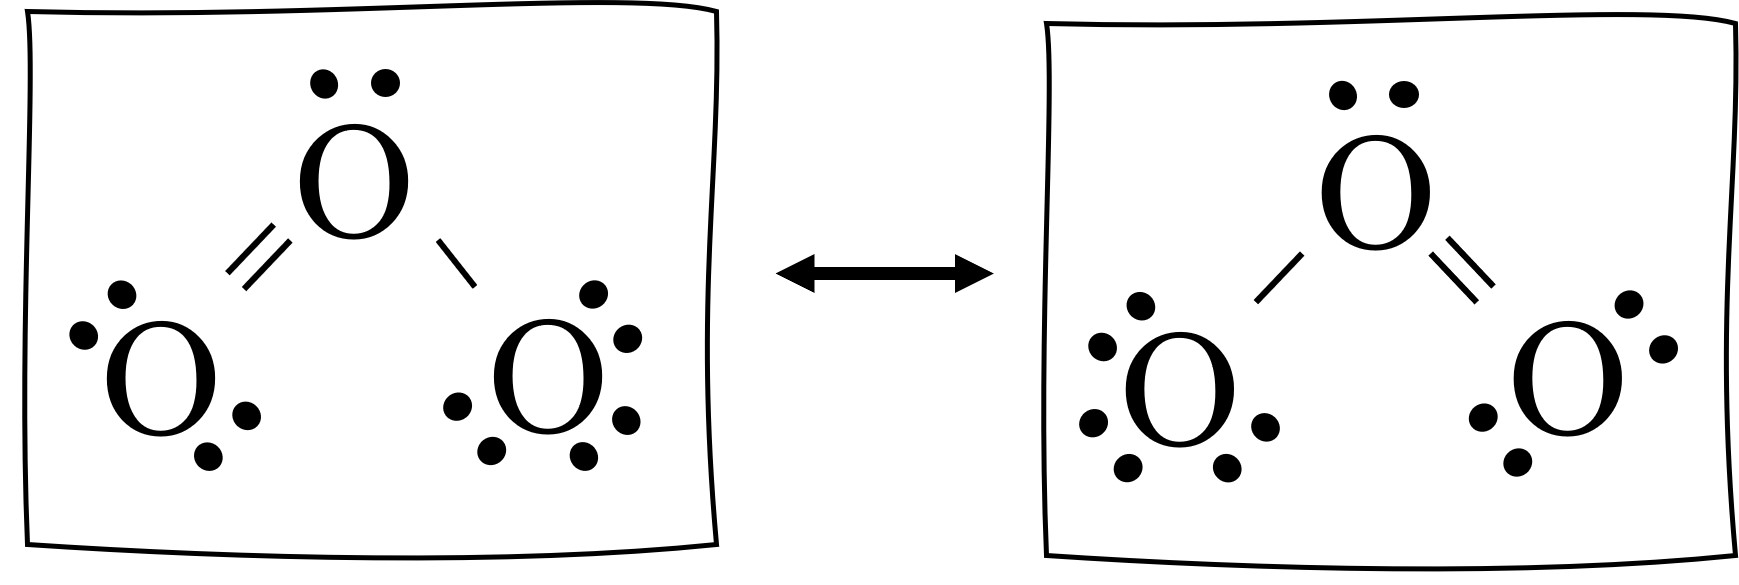
Bond Order and Ozone Depletion

The stability of molecules and their susceptibility to bond breaking by radiation can be related to their bond order. For ozone (O3), the bond order is 1.5, indicating a resonance hybrid between single and double bonds. In contrast, diatomic oxygen (O2) has a bond order of 2, representing a stronger double bond. Consequently, the bonds in oxygen molecules are stronger than those in ozone molecules. This difference in bond strength means that ozone bonds require less energy to break and can be dissociated by lower energy, longer wavelength ultraviolet (UV) light compared to the bonds in diatomic oxygen. This characteristic is fundamental to understanding ozone depletion in the stratosphere.
Diagram

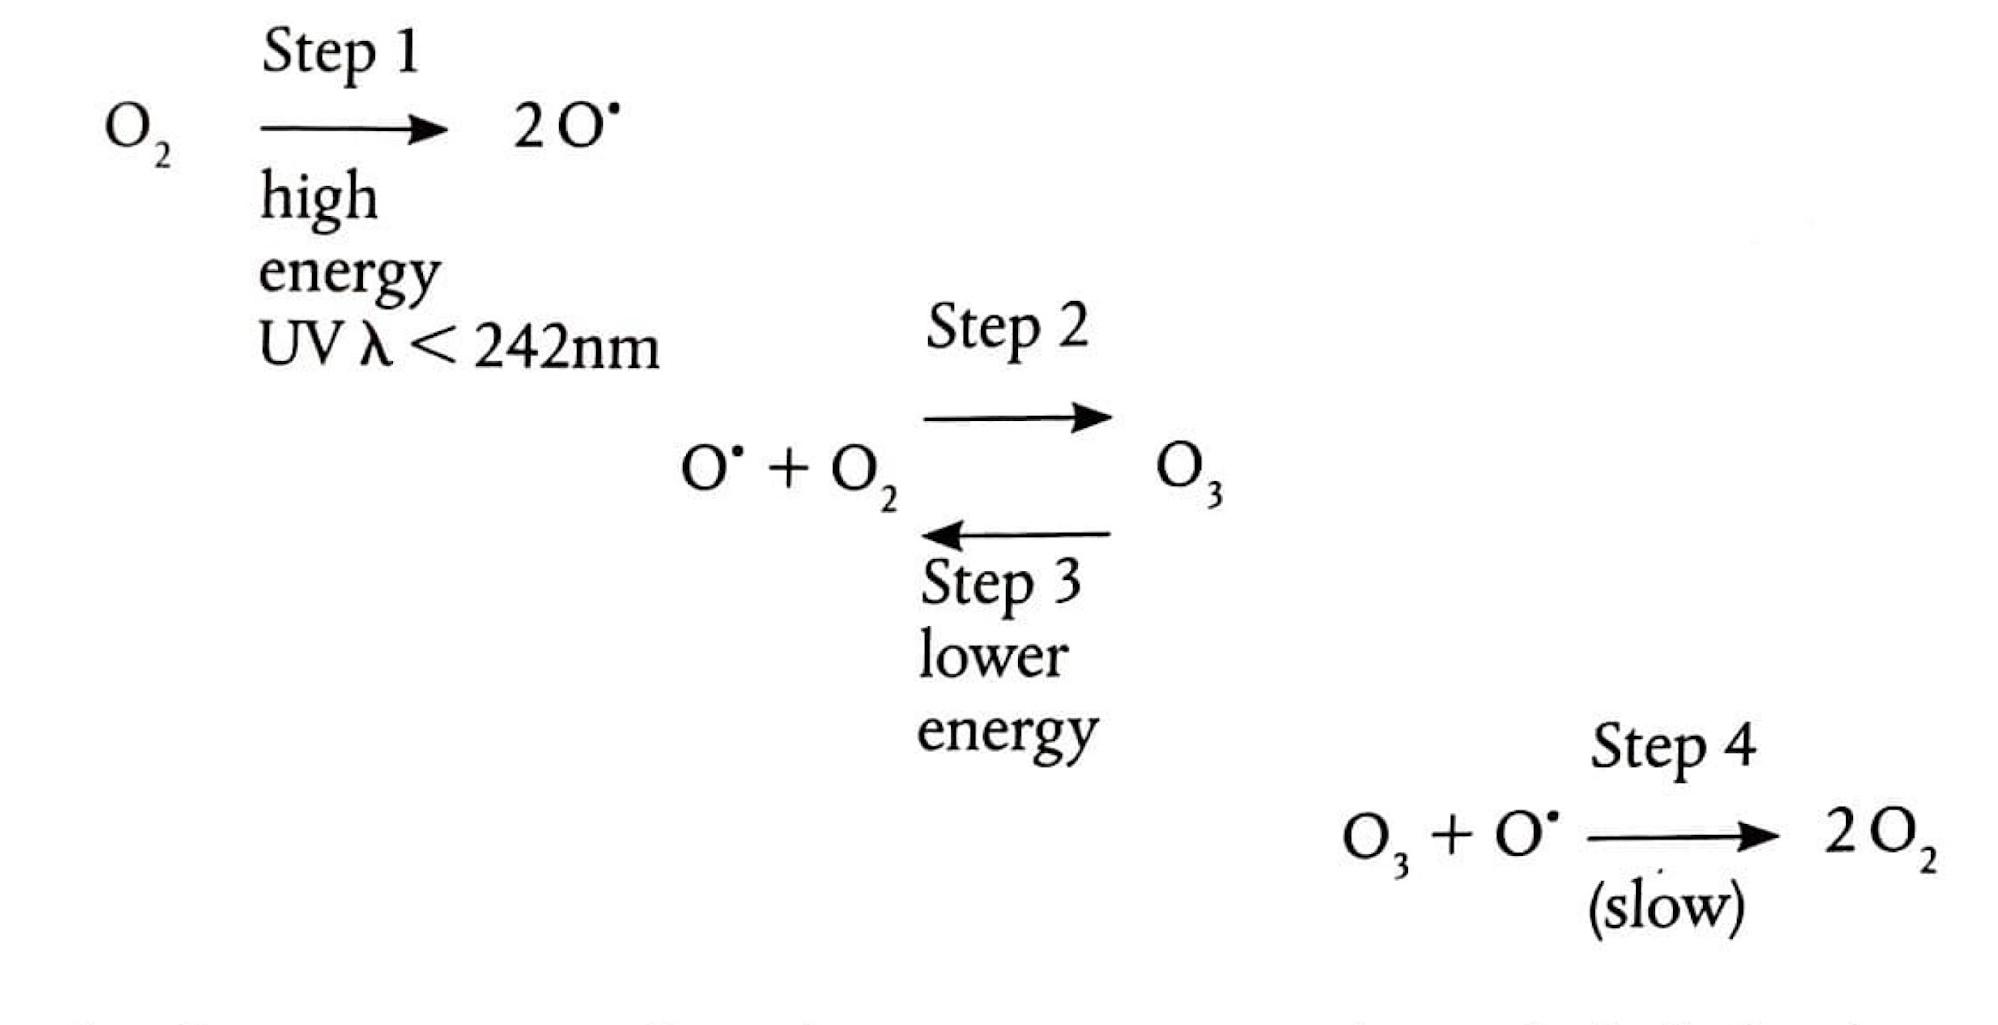
The Chapman Cycle: Ozone Formation and Removal

The concentration of ozone in the stratosphere is maintained through a dynamic equilibrium known as the Chapman Cycle. This cycle involves both the formation and removal of ozone, ideally at balanced rates, leading to a steady state. The process begins with the photodissociation of diatomic oxygen (O2) by high-energy UV radiation, forming highly reactive oxygen free radicals (O•). This bond breaking is endothermic. These free radicals then react with intact oxygen molecules to form ozone (O3). The formation of ozone is an exothermic process because new bonds are formed. Ozone can then be removed through two primary mechanisms: photodissociation by UV light, breaking it back into O2 and O•, or by reacting with an oxygen free radical to form two molecules of O2. Both of these removal processes are also exothermic. The delicate balance of these reactions ensures the protective ozone layer remains stable.
Diagram

Calculating Wavelength for Bond Breaking

The energy required to break a chemical bond can be directly related to the wavelength of electromagnetic radiation needed to cause that dissociation. This relationship is described by Planck's equation, E = hf, where E is energy, h is Planck's constant, and f is frequency. Since the speed of light (c) is related to frequency and wavelength (λ) by c = λf, we can substitute f = c/λ into Planck's equation to get E = hc/λ, or rearranged to find wavelength: λ = hc/E. Let's calculate the wavelength of UV radiation needed to break the bond in ozone, given that its bond energy is 363 kJ mol-1. First, convert the molar bond energy to the energy required to break a single bond:
Energy per photon (Ephoton) = (363,000 J mol-1) / (6.02 × 10²³ mol-1) = 6.03 × 10⁻¹⁹ J
Now, use the rearranged Planck's equation: λ = (h × c) / Ephoton
λ = (6.63 × 10⁻³⁴ J s × 3.00 × 10⁸ m s-1) / (6.03 × 10⁻¹⁹ J)
λ = 3.30 × 10⁻⁷ m
Converting this to nanometers: λ = 3.30 × 10-7 m × (109 nm / 1 m) = 330 nm
This calculation demonstrates that UV radiation with a wavelength of 330 nm is sufficient to break the bonds in ozone. Remember to use Avogadro's Number to convert between molar energy and the energy of a single photon.