IB Chemistry Study Summary

Thermodynamics

1
Intro to Lattice Enthalpies

Defining Key Enthalpies in Ionic Compound Formation

Several key enthalpy changes are crucial for understanding the formation and stability of ionic compounds. The First Ionization Energy (IE) quantifies the minimum energy needed to remove one mole of electrons from one mole of gaseous atoms, forming positive ions. For example, the first ionization of sodium is represented as Na(g) → Na+(g) + e-(g), with an associated enthalpy change (ΔHi°) of +496 kJ mol-1. Conversely, Electron Affinity (EA) describes the enthalpy change when one mole of gaseous electrons is added to one mole of gaseous atoms, forming negative ions.
For chlorine, this is Cl(g) + e-(g) → Cl-(g), with an enthalpy change (ΔHe°) of -349 kJ mol-1.
Finally, Lattice Enthalpy (ΔHlat°) is defined as the enthalpy change that occurs when one mole of a solid ionic compound is separated into its constituent gaseous ions under standard conditions.
For sodium chloride, this process is NaCl(s) → Na+(g) + Cl-(g), with a ΔHlat° of +790 kJ mol-1.

Understanding and Determining Lattice Enthalpies

While the formation of an ionic lattice from gaseous ions is an exothermic process, lattice enthalpies are conventionally defined as the enthalpy change for the reverse, endothermic process: breaking apart one mole of a solid ionic lattice into its gaseous ions. It is important to note that lattice enthalpies cannot be determined directly through experimental means. Instead, they are calculated indirectly using the Born-Haber cycle, which is a specific application of Hess's Law. This cycle illustrates the enthalpy changes involved in the formation of a solid ionic compound from its constituent elements in their standard states, proceeding through several intermediate steps that include ionization energies, electron affinities, atomization energies, and finally, the lattice formation enthalpy. The overall enthalpy change for the formation of the solid ionic compound from its gaseous ions, as depicted in the Born-Haber cycle, will be the negative of the lattice enthalpy (-ΔHlat°).
2
Standard Enthalpy Definitions

Standard Enthalpy of Formation (ΔHfΘ)

The standard enthalpy of formation (ΔHfΘ) is defined as the enthalpy change that occurs when one mole of a pure compound is formed from its constituent elements, with all substances in their standard states. These standard conditions are typically 298 K (25 °C) and a pressure of 100 kPa. For example, the formation of ammonia (NH
Diagram
3) from its elements can be represented by the equation:
32H2(g) + 12N2(g) → NH3(g).
It is important to note that the formation of most substances is an exothermic process, meaning that energy is released during their formation. This concept is a fundamental aspect of thermochemistry and was covered in previous studies. 

First Ionization Energy (Ei)

The first ionization energy (Ei) represents the standard enthalpy change when one mole of gaseous atoms is converted into one mole of gaseous ions, each carrying a single positive charge. This process can be generalized as M(g) → M+(g) + e-. Ionization energy is always an endothermic process, as energy must be supplied to overcome the electrostatic attraction between the nucleus and the outermost electron. The second ionization energy follows the same principle but involves removing a second electron from a unipositive ion, which is also an endothermic process. This concept is crucial for understanding atomic structure and bonding and was previously covered in the bonding unit.
Diagram

First Electron Affinity (Ea)

The first electron affinity (Ea) is defined as the standard enthalpy change that occurs when one mole of gaseous atoms gains one electron to form one mole of gaseous ions, each with a single negative charge. This process can be represented as M(g) + e- → M
Diagram
-(g). For many non-metals, the first electron affinity is an exothermic process, indicating that energy is released when an electron is added to the atom. However, the second electron affinity, which involves adding an electron to an already negatively charged ion, is typically endothermic because energy is required to overcome the electrostatic repulsion between the incoming electron and the existing negative charge. This concept, like ionization energy, is fundamental to understanding chemical bonding and was covered in the bonding unit.

Enthalpy of Atomization (ΔHatΘ)

The enthalpy of atomization (ΔHatΘ) is the enthalpy change that accompanies the formation of one mole of gaseous atoms from an element in its standard state at 298 K and 100 kPa pressure. This process is always endothermic, as energy is required to break the bonds holding the atoms together in their elemental form and convert them into individual gaseous atoms. For example, the atomization of solid sodium is represented by Na(s) → Na(g).

Bond Dissociation Enthalpy (ΔH)

Bond dissociation enthalpy (ΔH) refers to the standard enthalpy change that occurs when one mole of gaseous molecules is broken down into separate gaseous atoms. This process, such as H2(g) → 2H(g), is always endothermic because energy must be supplied to break the covalent bonds.
Diagram

Lattice Enthalpy of Dissociation (ΔHLΘ)

Lattice enthalpy is a measure of the strength of the electrostatic forces of attraction between ions in an ionic solid. A higher lattice enthalpy indicates stronger forces of attraction. These forces are completely overcome when the ions are separated into gaseous ions, scattered far enough apart that there is negligible attraction between them. The lattice enthalpy of dissociation (ΔHLΘ) is the energy change when one mole of a pure ionic solid is broken up into its constituent gaseous ions at 298 K and 100 kPa pressure (SATP). This process is always endothermic, as energy is required to break the ionic bonds. For example, the dissociation of magnesium chloride is represented by MgCl2(s) → Mg2+(g) + 2Cl-(g).

Lattice Enthalpy of Formation (ΔHLΘ)

Conversely, the lattice enthalpy of formation (ΔHLΘ) is defined as the enthalpy change when one mole of a pure ionic solid is formed from its constituent gaseous ions at 298 K and 100 kPa pressure (SATP). This process is always exothermic, as energy is released when gaseous ions come together to form a stable ionic lattice. For example, the formation of magnesium chloride from its gaseous ions is represented by Mg2+(g) + 2Cl-(g) → MgCl2(s).
Diagram

Relationship Between Lattice Dissociation and Formation Enthalpies

For a given ionic compound, the lattice dissociation enthalpy and lattice formation enthalpy are equal in magnitude but opposite in sign. For instance, in the case of sodium chloride (NaCl), the solid is more stable than its gaseous ions by 787 kJ mol-1. This means that the lattice dissociation enthalpy for NaCl(s) → Na+(g) + Cl-(g) is +787 kJ mol-1 (endothermic), while the lattice formation enthalpy for Na+(g) + Cl-(g) → NaCl(s) is -787 kJ mol-1 (exothermic).
Diagram

Factors Influencing Lattice Enthalpy

The magnitude of lattice enthalpy is primarily influenced by two key factors: the charges of the ions and their ionic radii.

Charges of Ions

A greater charge on the ions leads to a stronger electrostatic attraction between them. This stronger attraction results in a larger magnitude of lattice enthalpy, making the lattice formation more exothermic and the lattice dissociation more endothermic. For example, compounds with +2 and -2 ions will generally have higher lattice enthalpies than those with +1 and -1 ions, assuming similar ionic radii.

Ionic Radii

Smaller ionic radii result in a closer proximity between the centers of the ions, leading to a stronger electrostatic attraction. Consequently, smaller ions contribute to a larger magnitude of lattice enthalpy. Therefore, a stronger attraction, whether due to higher charges or smaller ionic radii, will result in a more exothermic lattice formation enthalpy and a more endothermic lattice dissociation enthalpy.
3
Born-Haber Cycles

The Nature of Enthalpy Changes in Chemical Reactions

Enthalpy changes are fundamental to chemical reactions, representing the heat absorbed or released during a process. These changes can occur at various stages within a reaction pathway. To systematically illustrate these multiple enthalpy changes, Max Born and Fritz Haber developed a conceptual tool known as the Born-Haber cycle.
Diagram

Understanding Born-Haber Cycles and Hess's Law

Born-Haber cycles are specialized applications of Hess's Law, specifically designed to analyze the formation of ionic compounds. While similar to general Hess's cycles, their primary focus is on determining the lattice enthalpy of ionic solids. According to Hess's Law, the total enthalpy change for a reaction is independent of the pathway taken, meaning that the sum of all enthalpy changes in a complete cycle must equal zero. This principle reflects the conservation of energy, as energy cannot be created or destroyed.
Diagram

Key Components and Calculation Principles of Born-Haber Cycles

Born-Haber cycles involve several distinct enthalpy changes that connect different states of matter relevant to the formation of an ionic compound. These states typically include: the ionic compound in its solid state (s), gaseous ions (g), elements in their standard states, and gaseous metal ions, electrons, and non-metal atoms. The enthalpy of formation (ΔH
Diagram
f) of the ionic compound is a crucial value, and according to Hess's Law, it can be calculated as the sum of all other enthalpy changes within the cycle.

Constructing a Born-Haber Cycle: A Step-by-Step Approach

When constructing a Born-Haber cycle, it is essential to identify and correctly place each type of enthalpy change. The solid ionic compound is conventionally placed at the bottom of the cycle, representing the final product. The elements in their standard states, which are the starting materials for the formation reaction, are typically shown on the left. The initial steps usually involve the atomisation of the elements, followed by the ionisation of the metal and the electron affinity of the non-metal. Finally, the lattice enthalpy of formation connects the gaseous ions to the solid ionic compound. To calculate an unknown enthalpy, such as the lattice enthalpy of formation, one can work backward through the cycle, applying the principle that the sum of enthalpy changes in a closed loop is zero.
Diagram

Practical Application: Calculating Lattice Enthalpy of Formation

In a Born-Haber cycle, the solid ionic compound is always positioned at the lowest energy level. The left side of the diagram typically represents the constituent elements in their standard states. The first transformations usually involve the atomisation of these elements, followed by the ionisation energies for the metal and the electron affinity for the non-metal. The final step on the right side of the cycle involves the lattice enthalpy of formation, which describes the energy released when gaseous ions combine to form one mole of a solid ionic compound. To calculate the lattice enthalpy of formation, one can sum the enthalpy changes of all other steps in the cycle, ensuring that the signs are reversed for any steps that go against the direction of the overall formation reaction.
Diagram
For example, consider the calculation of the lattice enthalpy of formation (ΔHΘL) using the following hypothetical values (kJ mol-1):
Enthalpy of atomisation (Na):  +107 
Enthalpy of atomisation (Cl): +121
First ionisation energy (Na): +502 
Electron affinity (Cl): -355 
Enthalpy of formation (ΔHΘF): -411 
 If the enthalpy of formation (ΔHΘF) is -411 kJ mol-1, and the sum of the other enthalpy changes (excluding lattice enthalpy) is
+107 + 121 + 502 - 355 = +375 kJ mol-1, then the equation for the cycle becomes:
 ΔHΘF = (Sum of other ΔH's) + ΔHΘL -411 = +375 + ΔHΘL ΔHΘL = -411 - 375 ΔHΘL = -786 kJ mol-1
 It is important to note that this value represents the lattice enthalpy of formation. The lattice enthalpy of dissociation, which is the energy required to break one mole of the ionic solid into its gaseous ions, would have the opposite sign, i.e., +786 kJ mol-1.

Constructing a Born-Haber Cycle for Magnesium Chloride (MgCl2)

To apply these principles, let's construct a Born-Haber cycle for magnesium chloride (MgCl2) and determine its enthalpy of formation. We will use the following enthalpy values: * Second Ionisation Energy of Mg (ΔH 2IE Mg) = +1451 kJ mol-1 * Enthalpy of atomisation of Mg (ΔHat Mg) = +148 kJ mol-1 * Enthalpy of atomisation of Cl (ΔHat Cl) = +122 kJ mol-1 Additional data, such as the first ionisation energy of magnesium, the electron affinity of chlorine, and the lattice enthalpy of MgCl2, would typically be obtained from data books to complete the cycle.
Diagram
4
Enthalpy of Hydration & Solution

Reversible Nature of Solution Formation

When a substance dissolves in a solvent, the process is often reversible. For instance, copper(II) sulfate (CuSO4) can react with water to form hydrated copper(II) sulfate (CuSO4·5H2O), a process represented by the equation: CuSO4 + 5H2O → CuSO4·5H2O. Conversely, the hydrated form can lose its water molecules to revert back to anhydrous copper(II) sulfate: CuSO4·5H2O → CuSO4 + 5H2O. This dynamic equilibrium highlights that the formation and decomposition of hydrates are interconvertible processes.
Diagram

Defining Enthalpy of Hydration

The enthalpy of hydration (ΔHΘhyd) is defined as the enthalpy change that occurs when one mole of gaseous ions is dissolved in a large amount of water to form a dilute solution. This process is always exothermic, meaning it releases energy, as the gaseous ions are stabilized by interactions with polar water molecules. A general representation for the hydration of gaseous ions is: Na+(g) + Cl-(g) → Na+(aq) + Cl-(aq).

Illustrative Examples of Hydration Equations

To further clarify the concept of enthalpy of hydration, here are several examples of hydration equations for various ionic compounds:
Diagram
  • Potassium chloride: K+(g) + Cl-(g) → K+(aq) + Cl-(aq)
  • Potassium sulfide: 2K+(g) + S2-(g) → 2K+(aq) + S2-(aq)
  • Lithium bromide: Li+(g) + Br-(g) → Li+(aq) + Br-(aq)
  • Magnesium chloride: Mg2+(g) + 2Cl-(g) → Mg2+(aq) + 2Cl-(aq)
  • Magnesium oxide: Mg2+(g) + O2-(g) → Mg2+(aq) + O2-(aq)
  • Sodium fluoride: Na+(g) + F-(g) → Na+(aq) + F-(aq)
  • Sodium oxide: 2Na+(g) + O2-(g) → 2Na+(aq) + O2-(aq)
  • Aluminium chloride: Al3+(g) + 3Cl-(g) → Al3+(aq) + 3Cl-(aq)
  • Aluminum nitride: Al3+(g) + N3-(g) → Al3+(aq) + N3-(aq)
  • Aluminium oxide: 2Al3+(g) + 3O2-(g) → 2Al3+(aq) + 3O2-(aq)

Defining Enthalpy of Solution

The enthalpy of solution (ΔHΘsol) is defined as the enthalpy change when one mole of a substance dissolves in a large excess of water under standard conditions (298 K and 100 kPa pressure). This process can be either exothermic or endothermic, depending on the specific substance. A typical example is the dissolution of sodium chloride: NaCl(s) → Na+(aq) + Cl-(aq).

Illustrative Examples of Solution Equations

Here are several examples of enthalpy of solution equations for various ionic compounds:
  • Potassium chloride: KCl(s) → K+(aq) + Cl-(aq)
  • Potassium sulfide: K2S(s) → 2K+(aq) + S2-(aq)
  • Lithium bromide: LiBr(s) → Li+(aq) + Br-(aq)
  • Magnesium chloride: MgCl2(s) → Mg2+(aq) + 2Cl-(aq)
  • Magnesium oxide: MgO(s) → Mg2+(aq) + O2-(aq)
  • Sodium fluoride: NaF(s) → Na+(aq) + F-(aq)
  • Sodium oxide: Na2O(s) → 2Na+(aq) + O2-(aq)
  • Aluminium chloride: AlCl3(s) → Al3+(aq) + 3Cl-(aq)
  • Aluminum nitride: AlN(s) → Al3+(aq) + N3-(aq)
  • Aluminium oxide: Al2O3(s) → 2Al3+(aq) + 3O2-(aq)

Energetics of Dissolving Ionic Compounds: Lattice Enthalpy

When an ionic compound dissolves in water, there is an associated enthalpy change. One crucial component of this change is the lattice enthalpy (ΔHΘlatt), which represents the energy required to break apart one mole of a solid ionic lattice into its constituent gaseous ions. This process involves overcoming strong electrostatic forces and is therefore always endothermic, requiring an input of energy.

Energetics of Dissolving Ionic Compounds: Hydration Enthalpy

Following the breaking of the ionic lattice, the gaseous ions interact with water molecules. The enthalpy of hydration (ΔHΘhyd) quantifies the energy released when these gaseous ions attract and become surrounded by water molecules, forming aqueous ions. This process involves the formation of new ion-dipole bonds and is consequently exothermic, releasing energy.

Overall Enthalpy of Solution as a Two-Step Process

The overall enthalpy of solution (ΔHΘsol) for an ionic compound can be conceptualized as a two-step process, although in reality, these steps occur simultaneously. First, the solid ionic lattice breaks down into gaseous ions (ΔHΘlatt, endothermic). Second, these gaseous ions are hydrated by water molecules to form aqueous ions (ΔHΘ
Diagram
hyd, exothermic). The net enthalpy change for the dissolution process is the sum of these two enthalpy changes: ΔHΘsol = ΔHΘlatt + ΔHΘhyd.

Conventions for Writing Dissolution Equations

When writing equations for the dissolution of compounds, it is standard practice to always represent the solid salt on the left side of the equation, indicating it as a reactant. The products, the aqueous ions, are then written on the right side of the equation. This convention clearly illustrates the transformation from a solid ionic lattice to solvated ions in solution.
Diagram

Calculating Enthalpy of Solution

The enthalpy of solution can be calculated by combining the lattice enthalpy and the enthalpy of hydration. For example, if the lattice enthalpy is +778 kJ mol-1 (energy required to break the lattice) and the enthalpy of hydration is -774 kJ mol-1 (energy released upon hydration), the enthalpy of solution (ΔHΘsol) would be +778 kJ mol-1 + (-774 kJ mol-1) = +4 kJ mol-1. This positive value indicates that the dissolution process is endothermic overall.
Diagram
5
Entropy & Standard Entropy

Understanding Entropy

Entropy (S
Diagram
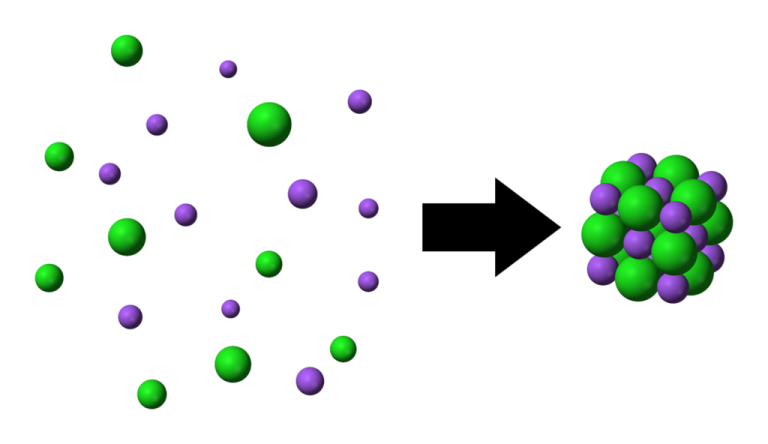
ϴ) is a fundamental thermodynamic property that quantifies the degree of disorder or randomness within a system. It can also be conceptualized as the number of possible arrangements or microstates that particles within a system can adopt. A higher number of accessible microstates corresponds to greater entropy. The more energy (quanta) particles possess, the more ways they can distribute that energy, leading to higher entropy. Similarly, an increase in the number of particles (moles) within a system generally results in higher entropy because there are more individual entities to arrange, as seen when salts dissolve.
Diagram

Factors Affecting Entropy

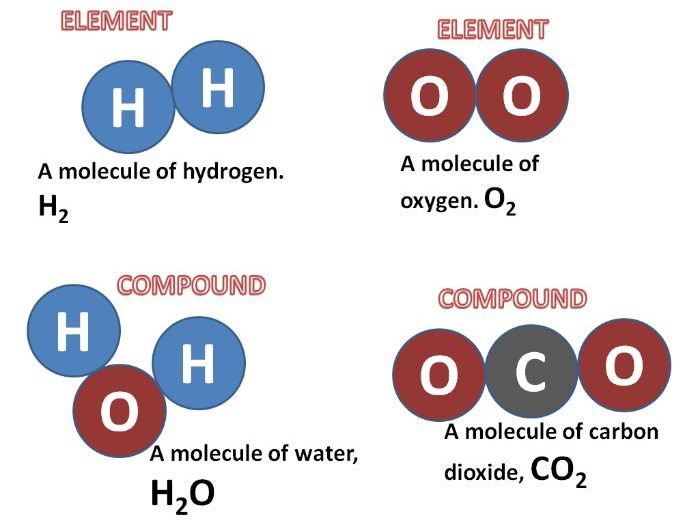
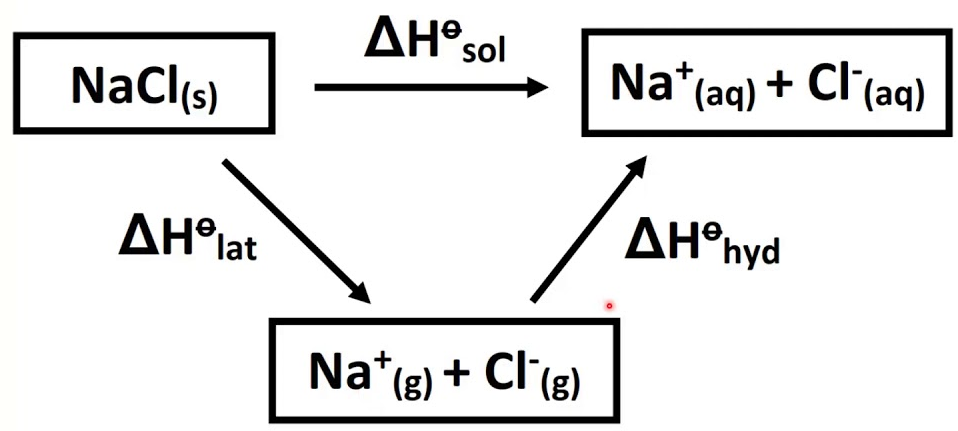
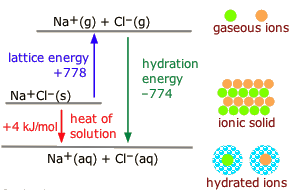
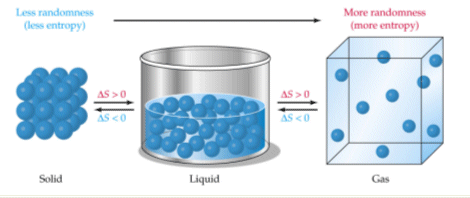
Several factors influence the entropy of a substance or system. For instance, the physical state of a substance significantly impacts its entropy; gases exhibit the highest entropy due to their particles having the greatest freedom of movement and arrangement, followed by liquids, and then solids, which have the most ordered structure. Therefore, NaCl(aq) has higher entropy than NaCl(s) because the dissolved ions are more disordered than in the solid lattice. Similarly, a more complex molecule like CO2 generally has higher entropy than a simpler one like CO because it has more atoms and thus more ways to vibrate and rotate. When a solute like NaCl dissolves in water to form NaCl(aq), the resulting solution has more arrangements and greater particle motion compared to the separate solute and solvent, leading to higher entropy. Comparing the entropy of N2(g) + O2(g) with 2NO(g) is difficult without specific values, as the number of moles of gas remains the same, suggesting a similar degree of disorder. Finally, increasing the temperature of a substance, such as H2O from room temperature to 50°C, increases its entropy because the particles gain more kinetic energy and move more vigorously, leading to a greater number of possible arrangements.
Diagram

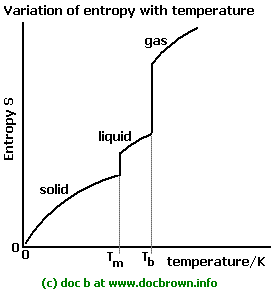
Entropy and Temperature Relationship

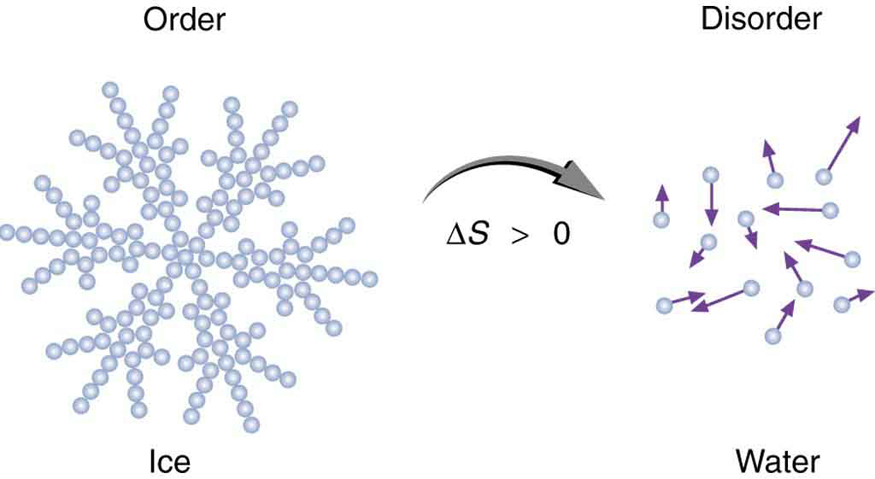
As temperature increases, the entropy of a substance generally increases. This is because particles gain more kinetic energy at higher temperatures, allowing them to occupy a wider range of energy states and spatial arrangements. This leads to a greater number of microstates and thus higher entropy. Significant and sudden increases in entropy are observed at phase transition points, specifically at the melting and boiling points. The increase in entropy is particularly pronounced at the boiling point, where a substance transitions from a relatively ordered liquid state to a highly disordered gaseous state. Gas particles possess significantly more translational and rotational freedom compared to liquid or solid particles, resulting in a much larger increase in disorder and entropy during vaporization.
Diagram

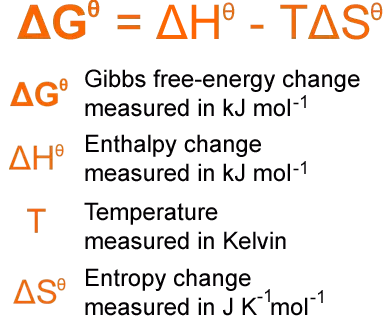
Standard Entropy (Sϴ)

Standard entropy (Sϴ) refers to the entropy of one mole of a substance under standard atmospheric conditions (SATP), which are defined as 100 kPa pressure and 298 K (25°C) temperature. These values are typically found in data booklets. The units for standard entropy are Joules per Kelvin per mole (J K-1 mol-1). It is crucial to ensure correct unit usage in calculations. Standard entropy values can vary based on several factors. For example, molecular complexity plays a role; NO2 has a standard entropy of 240 J K-1 mol-1, which is higher than NO's 211 J K-1 mol-1. This difference arises because the more complex NO2 molecule has more atoms and therefore more possible vibrational and rotational modes, leading to a greater number of microstates. The physical state of a substance also significantly impacts its standard entropy. For instance, H2O(g) has a standard entropy of 699 J K-1 mol-1, which is considerably higher than H2O(l)'s 189 J K-1 mol-1, reflecting the greater disorder in the gaseous state. It is important to note that spontaneous endothermic reactions, which absorb heat from their surroundings, can occur if the increase in entropy of the system and/or surroundings is sufficiently favorable.
Diagram

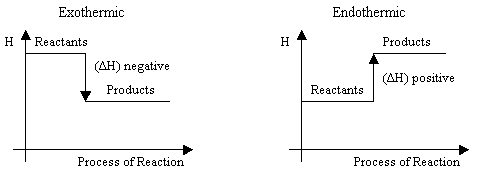
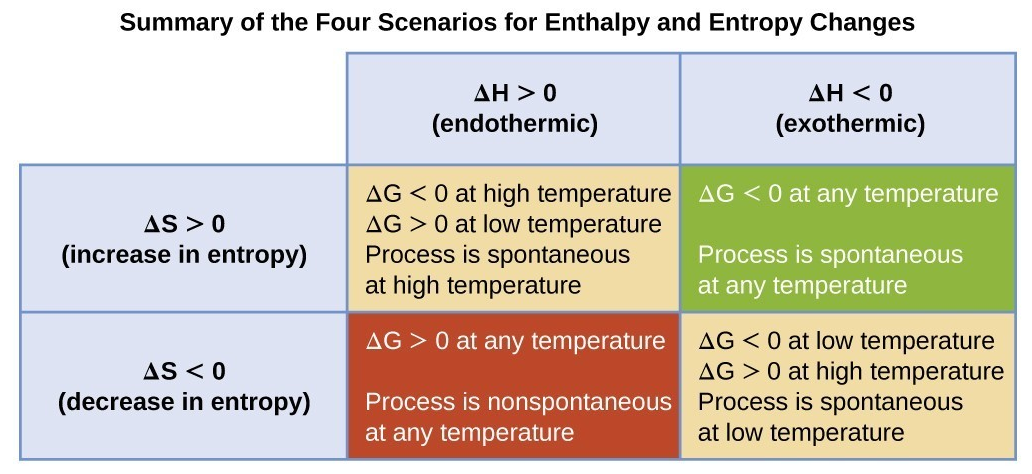
Interpreting Entropy Change

An increase in entropy for a reaction is indicated by a positive change in entropy (ΔS > 0), suggesting that the products are more disordered than the reactants. Conversely, a decrease in entropy is indicated by a negative change in entropy (ΔS < 0), meaning the products are more ordered. For a reaction to be considered feasible or spontaneous under specific conditions, the total entropy change (ΔStotal) must be positive.

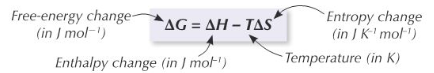
Calculating Entropy Change

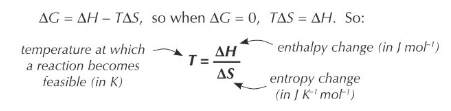
The total entropy change for a reaction can be determined using three key equations, which are essential to learn and apply. These equations allow for the calculation of entropy changes within the system, the surroundings, and the overall process. Thermodynamic data, including standard entropy values, can be found in section 13 of IB Chemistry data booklets. The entropy change of the system (ΔSsystem) is calculated by subtracting the sum of the standard entropies of the reactants from the sum of the standard entropies of the products: ΔSsystem = ∑Sϴproducts - ∑Sϴreactants
The entropy change of the surroundings (ΔSsurroundings) is related to the enthalpy change of the reaction (ΔH) and the absolute temperature (T) in Kelvin:
ΔSsurroundings = -ΔH/T (in J mol-1K-1)
Finally, the total entropy change (ΔStotal) for a process is the sum of the entropy change of the system and the entropy change of the surroundings: ΔStotal = ΔSsystem + ΔSsurroundings

Entropy Change Example 1: Calcium Oxidation

Let's calculate the total entropy change for the reaction 2Ca(s) + O2(g) → 2CaO(s) under standard conditions. We are given the standard enthalpy change (ΔHϴ = -1270 kJ mol-1) and the standard entropy values (Sϴ) for each substance: Ca = 41.6 J K-1 mol-1, O2 = 205 J K-1 mol-1, and CaO = 40 J K-1 mol-1.
First, we calculate the entropy change of the system: ΔSsystem = (2 × SϴCaO) - [(2 × SϴCa) + SϴO2]
ΔSsystem = (2 × 40) - [(2 × 41.6) + 205]
ΔSsystem = 80 - [83.2 + 205] ΔSsystem = 80 - 288.2
ΔSsystem = -208.2 J K-1 mol-1
Next, we calculate the entropy change of the surroundings. Note that ΔHϴ must be converted from kJ to J: ΔSsurroundings = -ΔHϴ/T ΔSsurroundings = -(-1270 × 1000 J mol-1) / 298 K
ΔSsurroundings = 1270000 J mol-1 / 298 K ΔSsurroundings = +4261.7 J K-1 mol-1
Finally, we calculate the total entropy change:
ΔStotal = ΔSsystem + ΔSsurroundings ΔStotal = -208.2 J K-1 mol-1 + 4261.7 J K-1 mol-1
ΔStotal = +4053.5 J K-1 mol-1 Since the total entropy change is positive (+4053.5 J K-1 mol-1), this reaction is kinetically feasible (spontaneous) under standard conditions.

Entropy Change Example 2: Dissolution of Sodium Bromide

Let's determine if NaBr dissolves in solution at 298 K. We are given the entropy change of the system (ΔSϴsystem = +55.0 J K-1 mol-1) for the reaction NaBr(s) → Na+(aq) + Br-(aq), and the standard enthalpy change (ΔHϴ = -0.6 kJ mol-1). First, we calculate the entropy change of the surroundings, converting ΔHϴ from kJ to J:
ΔSsurroundings = -ΔHϴ/T
ΔSsurroundings = -(-0.6 × 1000 J mol-1) / 298 K
ΔSsurroundings = 600 J mol-1 / 298 K
ΔSsurroundings = +2.01 J K-1 mol-1 (rounded to two decimal places)
Next, we calculate the total entropy change: ΔStotal = ΔSsystem + ΔSsurroundings
ΔStotal = +55.0 J K-1 mol-1 + 2.01 J K-1 mol-1
ΔStotal = +57.01 J K-1 mol-1 Since the total entropy change is positive (+57.01 J K-1 mol-1), the dissolution of NaBr in water is kinetically feasible (spontaneous) at 298 K.
6
Gibbs Free Energy

Introduction to Gibbs Free Energy

Diagram

Gibbs Free Energy, denoted as ΔG, is a fundamental thermodynamic concept named after the American mathematician Josiah Gibbs. It provides a powerful tool for determining the feasibility of a chemical reaction at a specific temperature by integrating the concepts of entropy, enthalpy, and temperature. The value of ΔG is crucial for predicting whether a reaction will proceed spontaneously without external energy input.

The standard Gibbs Free Energy change (ΔGθ) is often provided in data books, typically with a negative sign indicating a spontaneous reaction under standard conditions.

Diagram

Understanding Feasibility and Spontaneity

In chemistry, the terms "feasible" and "spontaneous" are used to describe reactions that, once initiated, will proceed to completion without requiring continuous energy input. A feasible reaction will continue on its own, while a spontaneous reaction occurs under a given set of conditions without external intervention. Spontaneous reactions are inherently linked to an increase in the overall entropy, or disorder, of the system and its surroundings.

The sign of ΔG is the key indicator of feasibility:

  • If ΔG is negative or equal to zero, the reaction is considered feasible (spontaneous).
  • If ΔG is positive, the reaction is not feasible (non-spontaneous) under the given conditions.

The Interplay of Enthalpy and Entropy

While many exothermic reactions, which release heat and thus increase the entropy of the surroundings, are spontaneous, enthalpy changes alone do not dictate whether a reaction will occur spontaneously. Some endothermic reactions, despite having a positive ΔH (meaning they absorb heat), can also be spontaneous at room temperature. This highlights that both enthalpy and entropy contribute significantly to the spontaneity of a reaction.

The Gibbs Free Energy Equation

The Gibbs Free Energy change (ΔG) quantifies the balance between the change in enthalpy (ΔH) and the change in entropy (ΔS) within a system, taking into account the absolute temperature (T) in Kelvin. The relationship is expressed by the following equation:

ΔG = ΔH - TΔS

Diagram

It is important to note that a negative ΔG value, while indicating theoretical feasibility, does not provide information about the reaction rate. A reaction might be thermodynamically feasible but kinetically very slow due to a high activation energy. Therefore, even if ΔG suggests a reaction should occur, it might not be observable within a reasonable timeframe.

Worked Example 1: Calculating Gibbs Free Energy

Let's calculate ΔG for the reaction of iron with oxygen to form iron(III) oxide (rusting):

2Fe(s) + 1½ O2(g) → Fe2O3(s)

Given ΔHϴ = -822 kJ mol-1

First, we calculate the change in entropy for the system (ΔSsystem) using the standard molar entropies (ΔSϴ) provided:

Substance ΔSθ (J K-1 mol-1)
Fe2O3 90
Fe 27.2
O2 205

ΔSsystem = ΔSproducts - ΔSreactants

ΔSsystem = 90 - [(2 × 27.2) + (1.5 × 205)]

ΔSsystem = 90 - [54.4 + 307.5]

ΔSsystem = 90 - 361.9 = -271.9 J K-1 mol-1

Now, we can calculate ΔG using the Gibbs Free Energy equation at a standard temperature of 298 K:

ΔG = ΔH - TΔS

Remember to convert ΔH to Joules and ΔS to J K-1 mol-1 for consistent units:

ΔG = (-822 × 1000 J mol-1) - [298 K × (-271.9 J K-1 mol-1)]

ΔG = -822000 J mol-1 - (-80996.2 J mol-1)

ΔG = -822000 J mol-1 + 80996.2 J mol-1

ΔG = -741003.8 J mol-1 (approximately -741 kJ mol-1)

Since ΔG is negative, this reaction is theoretically feasible. However, as observed with rusting, the reaction rate is very slow, indicating a high activation energy despite its thermodynamic favorability.

Feasibility and Temperature Dependence

The feasibility of a reaction is often temperature-dependent, as shown by the TΔS term in the Gibbs Free Energy equation. To determine feasibility without specific numerical calculations, we can analyze the signs of ΔH and ΔS and how they influence ΔG as temperature increases:

ΔH ΔS As Temperature Increases Feasibility
Positive Positive TΔS > ΔH (at high T) Yes - Above a certain temperature
Negative Positive ΔG becomes more negative Yes - Always
Negative Negative Not likely TΔS > ΔH (at low T) Usually (at low T)
Positive Negative ΔG always positive - no effect Never

Equilibrium and the Temperature of Feasibility

When ΔG is zero, a reaction is at equilibrium. This condition is frequently observed during phase transitions, such as boiling or melting points, where the forward and reverse processes occur at equal rates. We can determine the temperature at which a reaction reaches equilibrium, or becomes feasible, by rearranging the Gibbs Free Energy equation to solve for T when ΔG = 0:

0 = ΔH - TΔS

TΔS = ΔH

T = ΔH / ΔS

This rearranged equation allows us to calculate the minimum temperature at which a reaction becomes thermodynamically feasible.

Diagram

Worked Example 2: Calculating the Temperature of Feasibility

Let's calculate the temperature at which the reduction of iron(III) oxide with carbon becomes feasible:

Fe2O3(s) + 3C(s) → 2Fe(s) + 3CO(g)

Given ΔHθ = +493 kJ mol-1

First, we calculate the change in entropy for the system (ΔSsystem) using the standard molar entropies (ΔSθ) provided:

Substance ΔSθ (J K-1 mol-1)
Fe2O3 90
Fe 27.2
C 5.7
CO 198

ΔSsystem = ΔSproducts - ΔSreactants

ΔSsystem = [(2 × 27.2) + (3 × 198)] - [90 + (3 × 5.7)]

ΔSsystem = [54.4 + 594] - [90 + 17.1]

ΔSsystem = 648.4 - 107.1 = +541.3 J K-1 mol-1

To find the temperature at which the reaction becomes feasible, we set ΔG = 0:

ΔG = ΔH - TΔS

0 = (493 × 1000 J mol-1) - [T × 541.3 J K-1 mol-1]

T × 541.3 = 493000

T = 493000 / 541.3

T ≈ 910.8 K

Therefore, this reaction becomes feasible at approximately 910.8 K (or 637.8 °C). This type of calculation is highly valuable in industrial processes, such as metallurgy, to determine the minimum operating temperatures required to ensure a reaction proceeds, thereby optimizing energy consumption and efficiency.

7
Free Energy Graphs
Diagram

Understanding Free Energy Graphs for Enthalpy and Entropy

Free energy graphs provide a powerful visual tool for determining the enthalpy and entropy changes associated with a chemical reaction. By plotting Gibbs free energy (ΔG) against temperature (T), we can extract these crucial thermodynamic values. The relationship between Gibbs free energy, enthalpy, entropy, and temperature is defined by the equation ΔG = ΔH - TΔS. When ΔG is plotted on the y-axis and T on the x-axis, this equation takes the form of a straight line, y = mx + c.
Diagram

Extracting Enthalpy and Entropy from the Graph

In a graph where ΔG is the dependent variable (y-axis) and
temperature (T) is the independent variable (x-axis), the
gradient (m)of the line directly corresponds to the negative
of the entropy change (-ΔS). Consequently, the y-intercept (c)
of this line represents the enthalpy change (ΔH) of the reaction.
It is important to note that the entropy change itself will be the
negative of the calculated gradient. For instance, if the
gradient is -ΔS, then ΔS is the negative of that value.
Diagram

Applying Free Energy Graphs: A Practice Problem

To solidify your understanding, consider the following exercise: plot a graph using the provided data for the decomposition of lithium carbonate to calculate its ΔH and ΔS values. Furthermore, determine the specific temperature at which this reaction becomes just feasible, meaning ΔG = 0.
Diagram
Diagram