IB Chemistry Study Summary

Organic Chemistry

1
Advanced Mechanisms

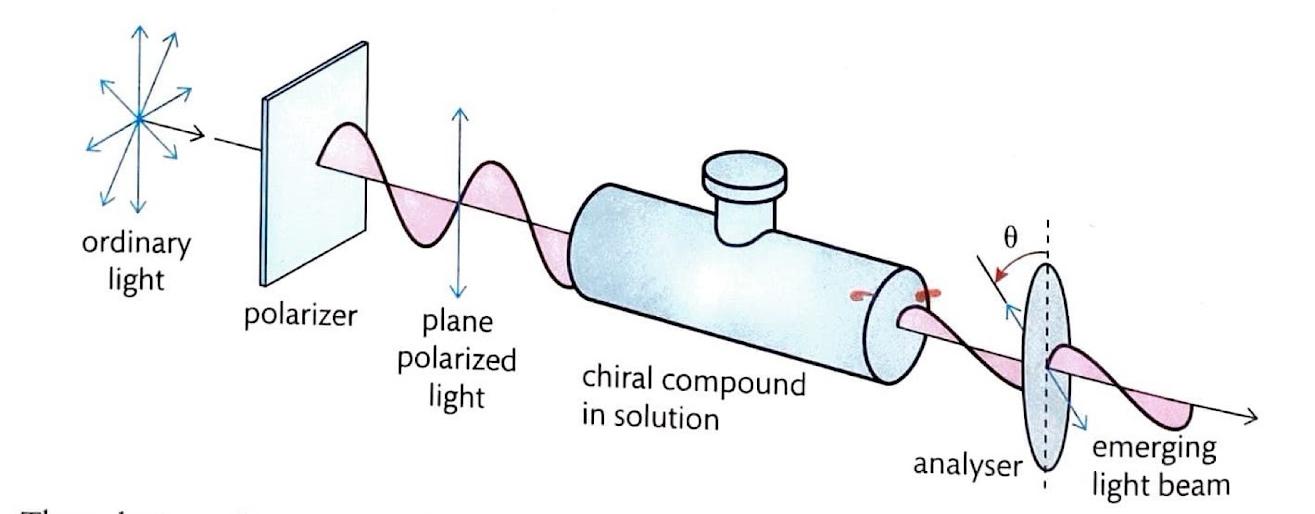
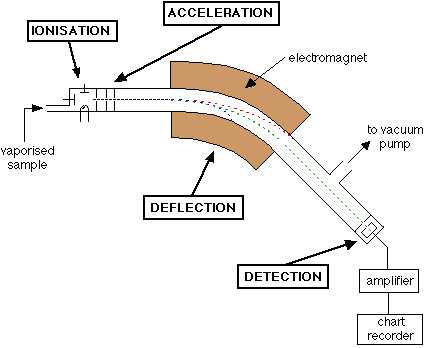
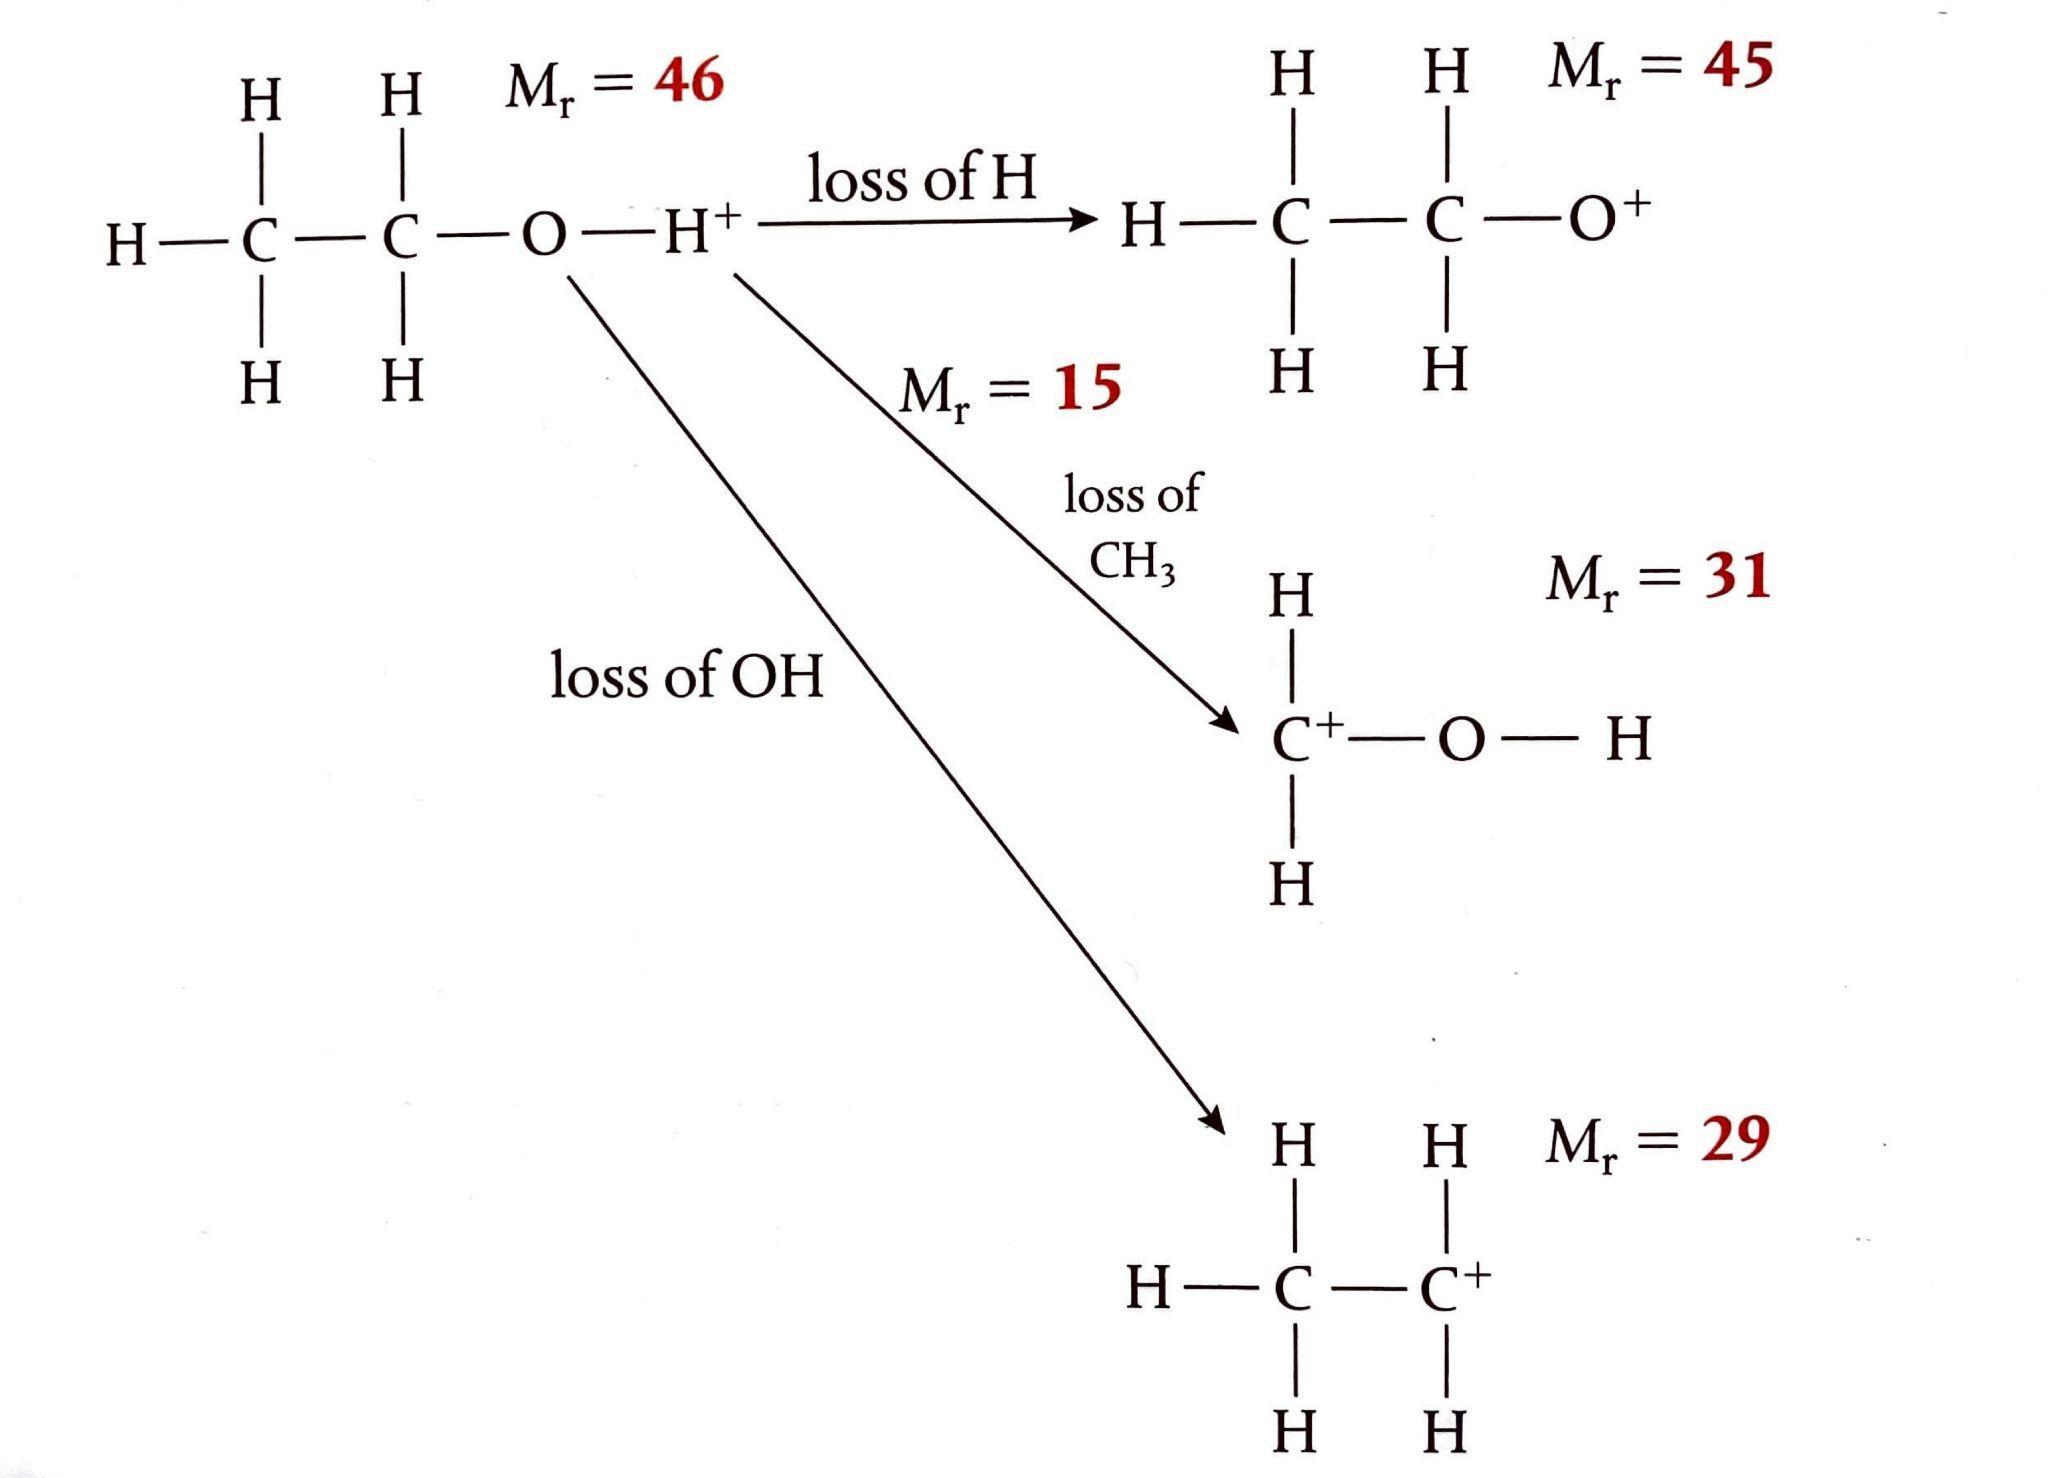
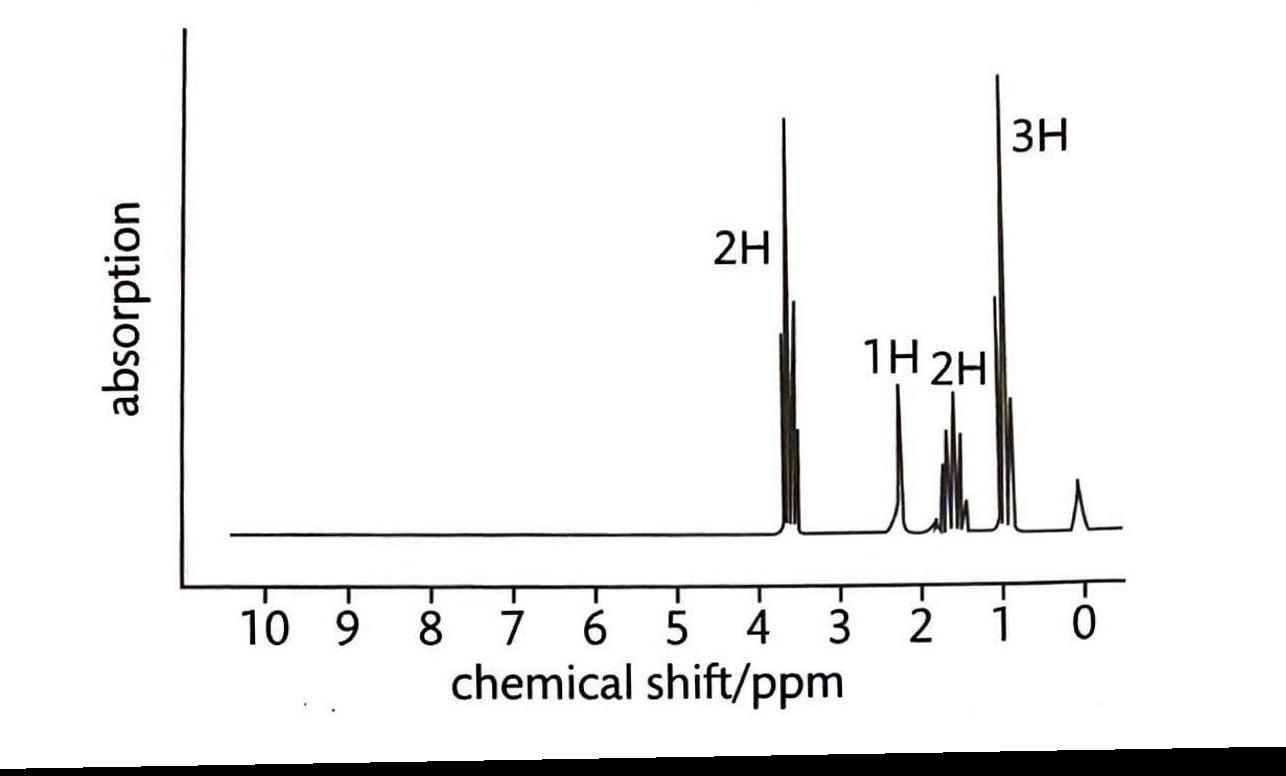
Organic Reaction Classification

Organic reactions are systematically categorized based on both the transformation that occurs and the underlying mechanism by which it happens. This classification includes broad types such as nucleophilic substitution and electrophilic addition or substitution. A key distinction in these mechanisms lies in the nature of the reacting species: nucleophiles and electrophiles. Nucleophiles, acting as Lewis bases, are electron donors that form new covalent bonds. Common examples include hydroxide ions (OH-), water (H2O), ammonia (NH3), and cyanide ions (CN-). Conversely, electrophiles function as Lewis acids, accepting electron pairs. Examples of electrophiles include hydrogen ions (H+), bromonium ions (Br+), and nitronium ions (NO2+).

Representing Electron Movement in Mechanisms

The movement of electron pairs during a reaction mechanism is visually represented by a curly arrow. The tail of this arrow indicates the origin of the electron pair, while the head points to its destination, illustrating the formation or breaking of a bond.
Diagram

Nucleophilic Substitution (SN) Reactions

Nucleophilic substitution reactions frequently occur with halogenoalkanes. The carbon-halogen bond in these compounds is polar, rendering the carbon atom electron-deficient and thus susceptible to attack by a nucleophile. During the reaction, the carbon-halogen bond undergoes heterolytic fission, a process where both shared electrons in the bond are retained by the halogen atom. This results in the halogen being released as a halide ion (a negative ion), which is referred to as the leaving group.
Diagram

Distinguishing SN1 and SN2 Reactions

Nucleophilic substitution reactions are broadly classified into two main types, SN1 and SN2, based on their reaction kinetics. SN1 reactions are first-order, meaning their rate depends solely on the concentration of the substrate (the halogenoalkane). In contrast, SN2 reactions are second-order, with their rate depending on the concentrations of both the substrate and the nucleophile.
Diagram

Characteristics of SN2 Reactions

SN2 reactions are single-step processes characterized by an unstable transition state. They are bimolecular, reflecting their second-order kinetics. In an SN2 reaction, a strong nucleophile attacks the electrophilic carbon atom from the side opposite to the leaving group. This "backside attack" is crucial for the reaction's stereochemical outcome. S
Diagram
N2 reactions proceed most rapidly with primary halogenoalkanes, where steric hindrance is minimized.
Diagram

Stereochemistry in SN2 Reactions

A significant consequence of the backside attack in SN2 reactions is the inversion of configuration at the carbon atom undergoing substitution. This means that the three-dimensional arrangement of groups around the carbon atom is inverted, much like an umbrella turning inside out.
Diagram
SN2 reactions are stereospecific, meaning that the stereochemistry of the reactants dictates the stereochemistry of the products. This is because bond formation and bond cleavage occur simultaneously in the transition state, preserving the stereochemical relationship. The precise three-dimensional arrangement of reactants directly determines the three-dimensional arrangement of the products, a characteristic that is particularly important in the synthesis of biologically active molecules such as amino acids and pharmaceuticals.

Solvent Effects on SN2 Reactions

SN2 reactions are favored by polar, aprotic solvents. These solvents, such as propanone ((CH3)2CO), methylene chloride (CH2Cl2), and ethanenitrile (CH3CN), lack -OH or -NH bonds and therefore do not form hydrogen bonds. They typically possess strong dipoles. Aprotic solvents solvate the metal cation associated with the nucleophile, effectively separating the nucleophile and increasing its energy state, which in turn enhances the reaction rate.

Characteristics of SN1 Reactions

SN1 reactions are two-step processes that involve a carbocation intermediate. They are unimolecular, exhibiting first-order kinetics. In an SN1 reaction, a relatively weak nucleophile can attack the electrophilic carbocation from either side, potentially leading to two different products. These reactions occur fastest with tertiary halogenoalkanes. The bulky alkyl groups in tertiary alkanes prevent direct nucleophilic attack via an SN2 mechanism (steric hindrance). Furthermore, the three alkyl groups stabilize the carbocation intermediate through a positive inductive (electron-donating) effect, which helps to delocalize the positive charge.
Diagram

Stereochemistry in SN1 Reactions

Unlike SN2 reactions, SN1 reactions are not stereospecific. The carbocation intermediate, stabilized by inductive effects, persists long enough for the second step of the reaction to occur. Since the carbocation is planar, the nucleophile can attack from either face with equal probability, leading to a racemic mixture if the carbon is chiral.
Diagram

Solvent Effects on SN1 Reactions

SN1 reactions are favored by polar, protic solvents. These solvents, which include water, alcohols, and carboxylic acids, contain -OH or -NH bonds and are capable of forming hydrogen bonds. Protic solvents effectively stabilize the carbocation intermediate through ion-dipole interactions, thereby facilitating the SN1 mechanism.
Diagram

Nucleophilic Substitution in Secondary Halogenoalkanes

Secondary halogenoalkanes can undergo both SN1 and SN2 reactions, making it challenging to precisely predict the predominant mechanism of nucleophilic substitution without further information about the specific conditions.

Factors Influencing Nucleophilic Substitution Reaction Rates

The rates of nucleophilic substitution reactions are influenced by several factors, including the reaction mechanism (S
Diagram
N1 vs. SN2), the nature of the leaving group, and the solvent used.

Impact of Mechanism on Reaction Rates

S
Diagram
N1 reactions generally proceed more quickly than SN2 reactions, particularly in the presence of protic solvents. This enhanced rate is attributed to the ability of protic solvents to stabilize the carbocation intermediate formed in SN1 reactions.

Influence of the Leaving Group on Reaction Rates

The nature of the leaving group significantly affects the rate of nucleophilic substitution. As one moves down a group in the periodic table, the electronegativity of the halogen decreases, making the carbon in the carbon-halogen bond less electron-deficient and thus less vulnerable to nucleophilic attack. However, the strength of the carbon-halogen bond also decreases down the group, making these bonds more easily broken. The overall effect on reaction rate depends on the balance of these factors. The reactivity of halogenoalkanes with silver nitrate in alcoholic solution can be used to compare the ease of C-X bond cleavage.
Diagram

Influence of Solvent on Reaction Rates

As previously discussed, the choice of solvent plays a critical role in determining the favored mechanism and thus the reaction rate. S
Diagram
N1 mechanisms are favored by polar, protic solvents, while SN2 mechanisms are favored by polar, aprotic solvents. To experimentally track the rate of nucleophilic substitution reactions, silver nitrate can be added, and the formation of a precipitate of the silver halide (each having a distinct color) can be observed. For instance, to achieve the fastest nucleophilic substitution reactions, one would select conditions that optimize either the SN1 or SN2 pathway based on the substrate and desired outcome.
Diagram

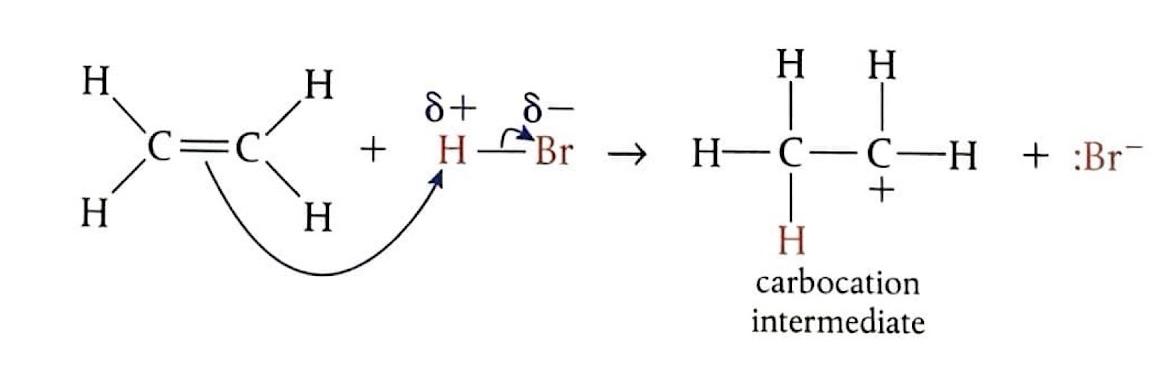
Electrophilic Addition Reactions

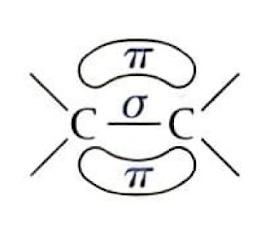
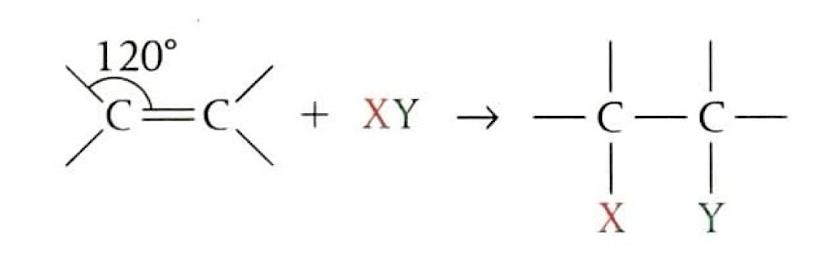
Alkenes are highly susceptible to electrophilic addition reactions due to the nature of their carbon-carbon double bond. This double bond consists of a strong sigma (σ) bond and a weaker pi (π) bond. The π bond, with its electron density located above and below the plane of the bond axis, is more easily broken and is highly attractive to electrophiles. The sp2 hybridized carbon atoms of the double bond result in a trigonal planar geometry, an open structure that facilitates electrophilic attack. Examples of electrophilic addition include the addition of halogens and hydrogen halides to alkenes, which typically occur under mild conditions. In these reactions, the electrophile is often generated through heterolytic fission.
Diagram
Diagram

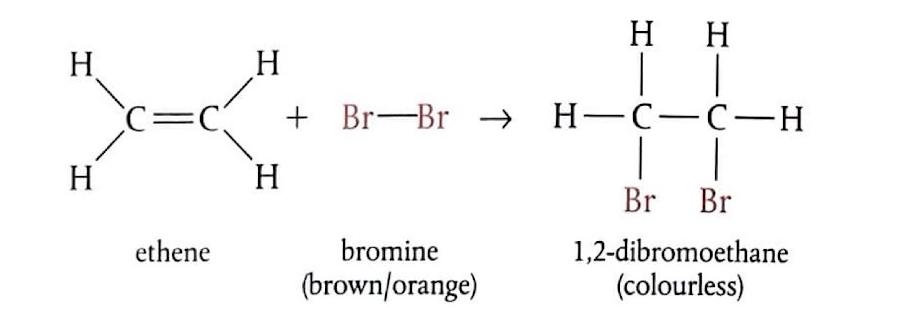
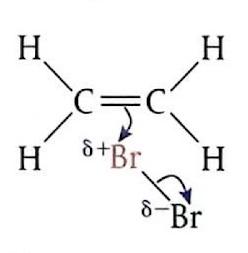
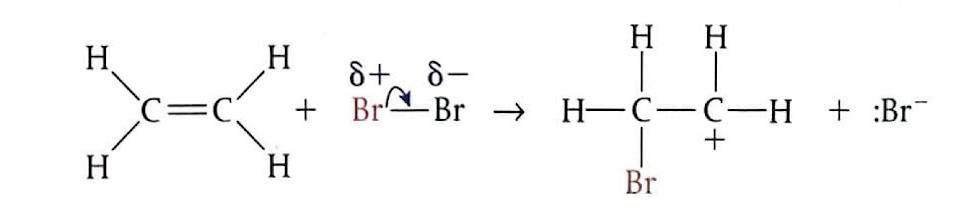
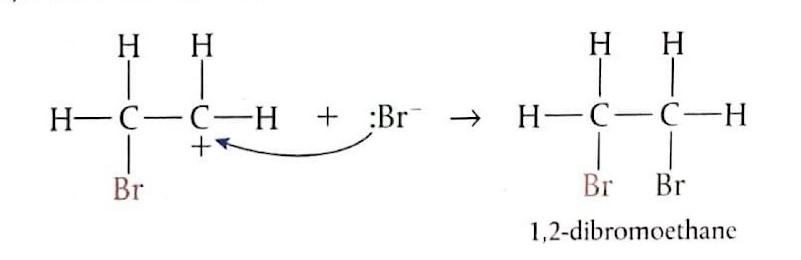
Electrophilic Addition of Bromine to Ethene

When ethene gas is bubbled through bromine water (which is brown) at room temperature, the product formed is 1,2-dibromoethane, which is colorless. The mechanism involves several steps: initially, the bromine molecule (Br2) approaches the electron-rich region of the ethene double bond and becomes polarized. Subsequently, the Br2 molecule undergoes heterolytic cleavage, and a bromonium ion (Br
Diagram
+) attacks the alkene, breaking the π bond. This is the slow, rate-determining step and leads to the formation of an unstable carbocation intermediate. Finally, the bromide ion (Br-) rapidly reacts with the carbocation intermediate to form the final product. The formation of both BrH2CCH2Br and BrH
Diagram
2CCH2Cl from the reaction of ethene with Br2 in the presence of Cl
Diagram
- ions serves as evidence for the electrophilic addition mechanism, specifically the carbocation intermediate. If a carbocation is formed, it can react with any available nucleophile (Br
Diagram
- or Cl-), leading to a mixture of products.

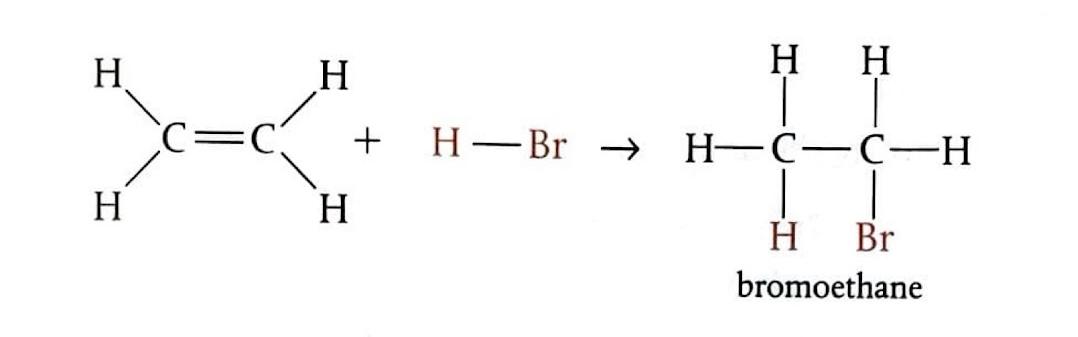
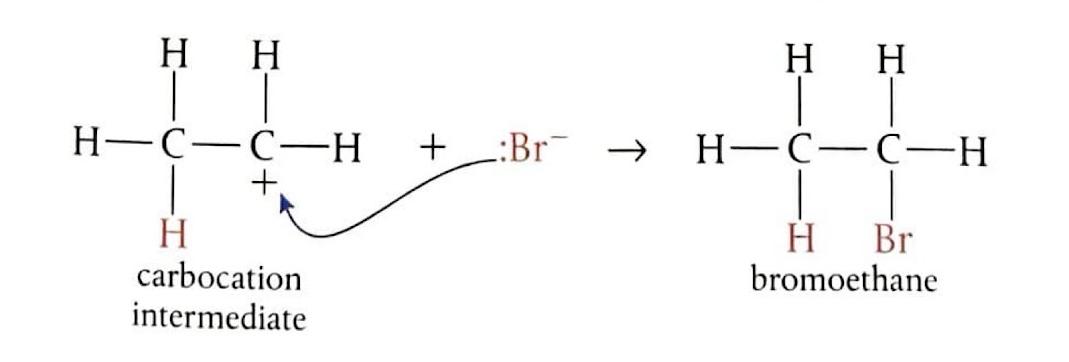
Electrophilic Addition of Hydrogen Bromide to Ethene

Bubbling ethene through concentrated hydrogen bromide (HBr) at room temperature produces bromoethane. In this reaction, HBr undergoes heterolytic fission to generate a hydrogen ion (H+) and a bromide ion (Br-). The electrophile, H
Diagram
+, attacks the double bond of ethene, forming an unstable carbocation. This carbocation intermediate then quickly reacts with the Br- ion to yield the final product.
Diagram

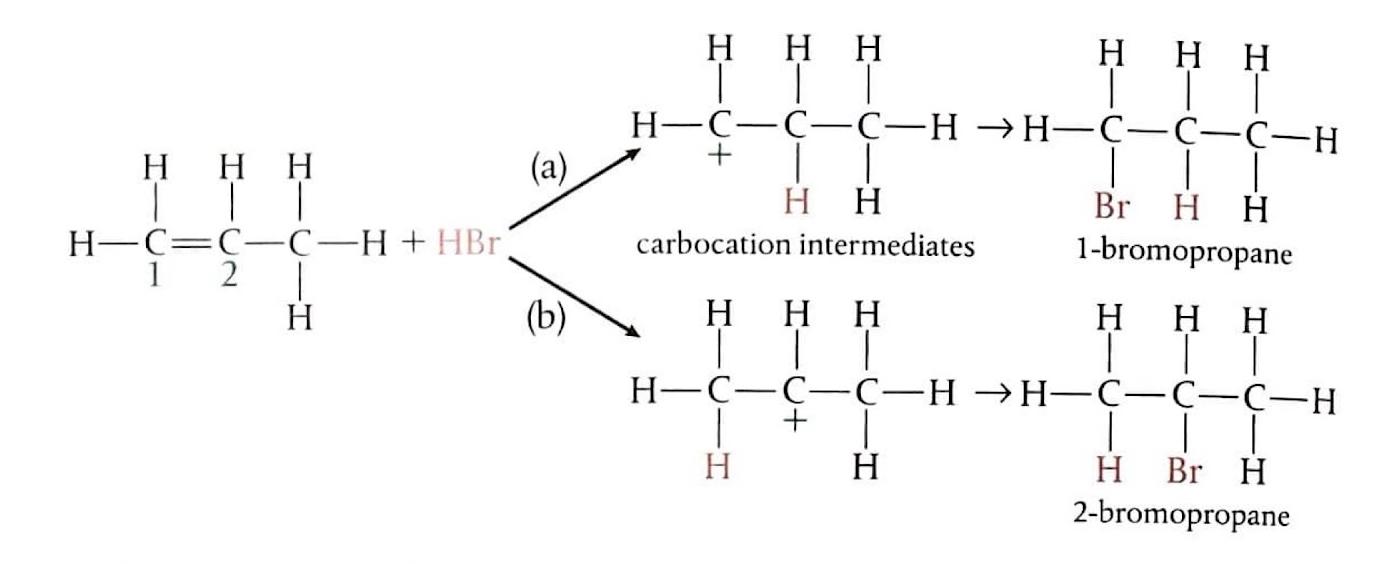
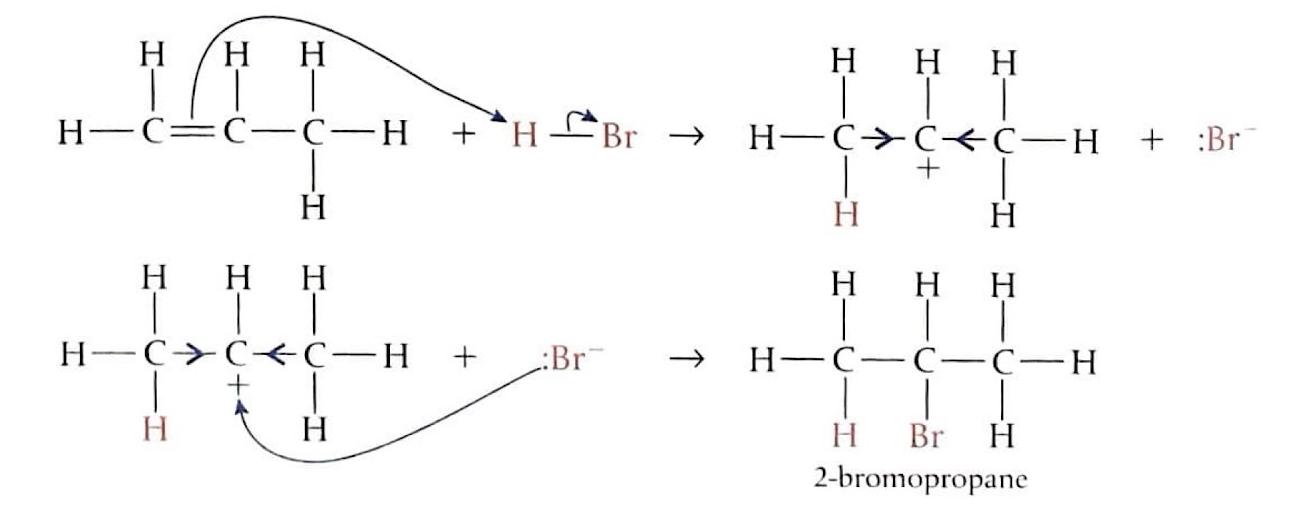
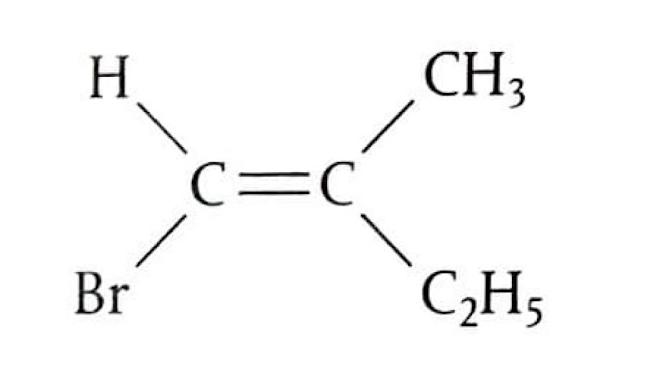
Electrophilic Addition to Unsymmetrical Alkenes: Propene + HBr

When an unsymmetrical alkene like propene reacts with a hydrogen halide such as HBr, two different products can theoretically form, depending on which carbon atom of the double bond the electrophile (H
Diagram
+) bonds to initially.
Diagram
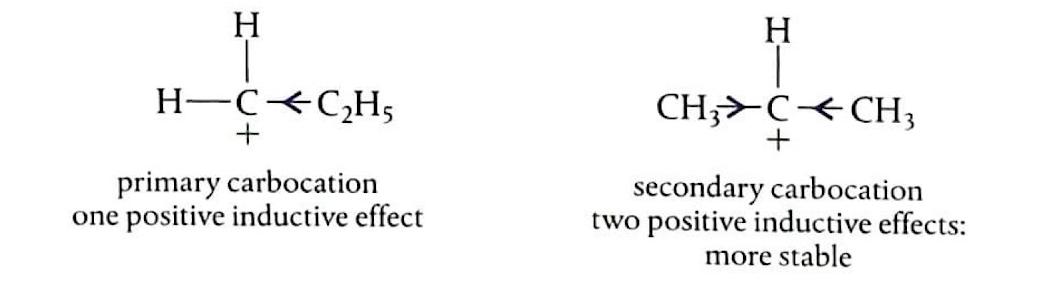
In the case of propene and HBr, pathway (a) leads to the formation of a primary carbocation, while pathway (b) results in a secondary carbocation. The secondary carbocation is more stable due to the greater positive inductive effect from two alkyl groups compared to one in the primary carbocation. Consequently, 2-bromopropane is the main product formed, often referred to as the "major" product.
Diagram

Markovnikov's Rule

Markovnikov's Rule provides a guideline for predicting the major product in electrophilic addition reactions to unsymmetrical alkenes. In technical terms, the more electropositive part of the reacting species (e.g., H
Diagram
+ from HBr) bonds to the least highly substituted carbon atom in the alkene. In simpler terms, the hydrogen atom will attach to the carbon atom of the double bond that is already bonded to a greater number of hydrogen atoms. Conversely, the carbocation will form on the carbon atom bonded to more carbon atoms, as this leads to a more stable carbocation intermediate. When asked to predict the major products of an electrophilic addition reaction, it is crucial to explain the carbocation stability based on inductive effects.
Diagram

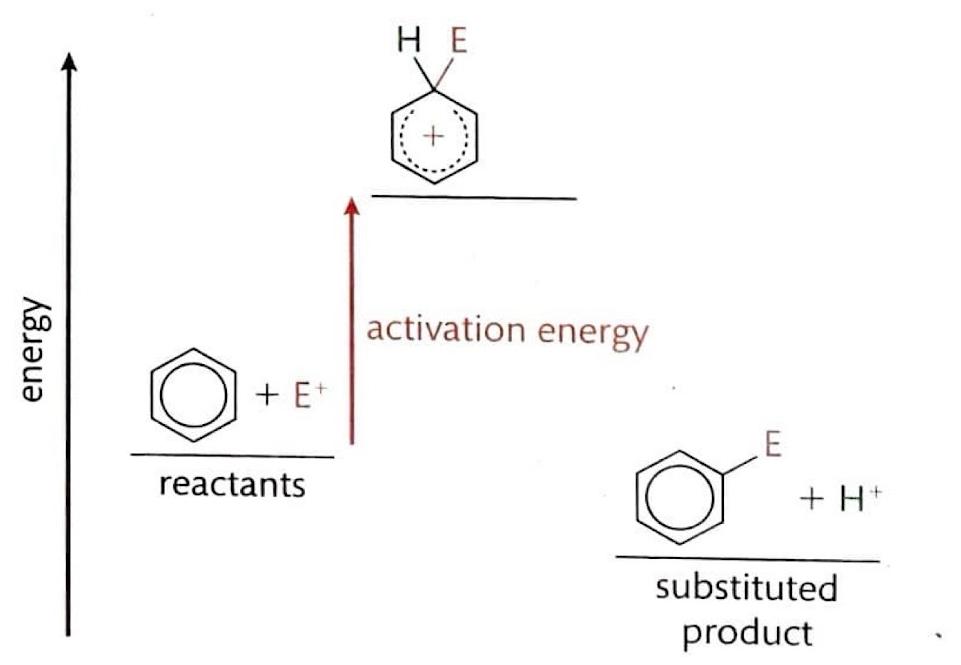
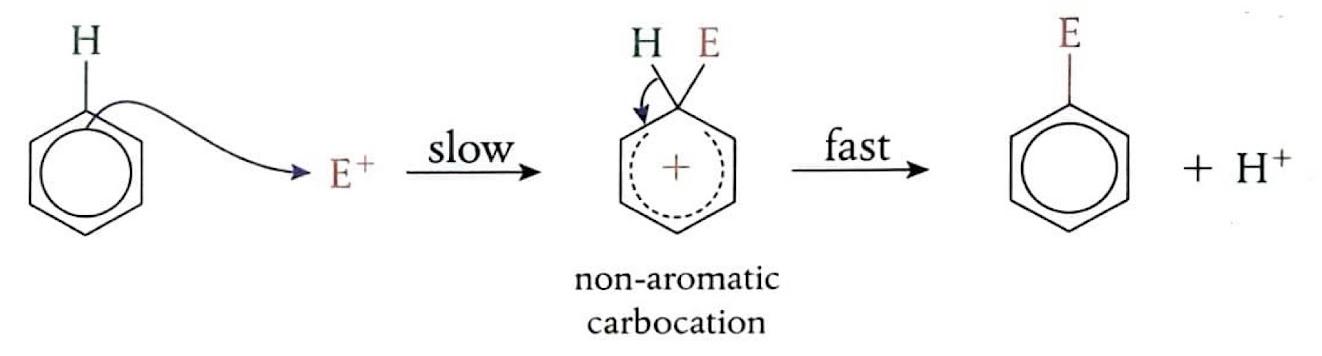
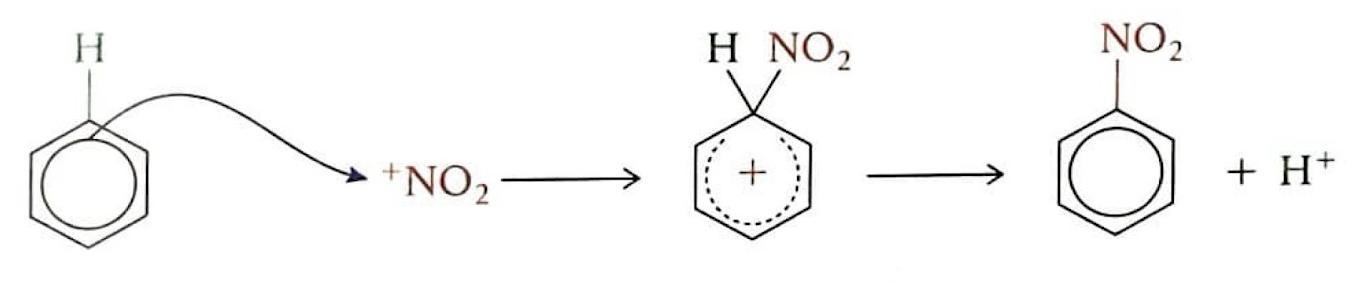
Electrophilic Substitution Reactions: Benzene

Despite being unsaturated, benzene exhibits a remarkably stable aromatic ring, which strongly favors substitution reactions over addition reactions. Benzene's delocalized π electron system creates a region of high electron density, making it attractive to electrophiles. In an electrophilic substitution reaction, a new bond is formed as one of the hydrogen atoms on the benzene ring is replaced. These reactions typically have a high activation energy and proceed slowly. The mechanism involves an electron pair from the benzene ring being attracted to the electrophile, which temporarily disrupts the delocalized π electron symmetry. This leads to the formation of an unstable carbocation intermediate where both the entering group and the leaving hydrogen are temporarily bonded. Subsequently, a hydrogen ion (H+) leaves, restoring the aromaticity and forming a more stable, electrically neutral product.
Diagram

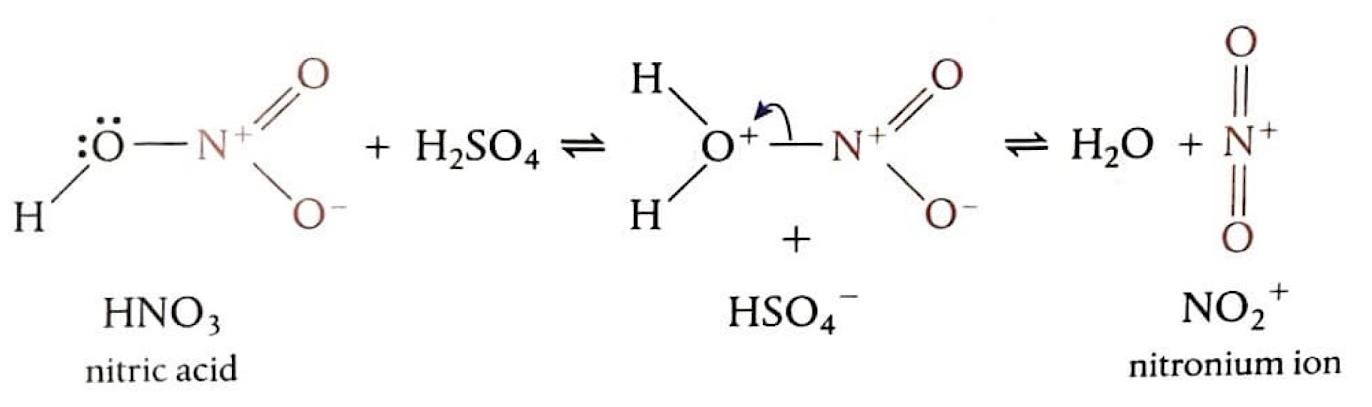
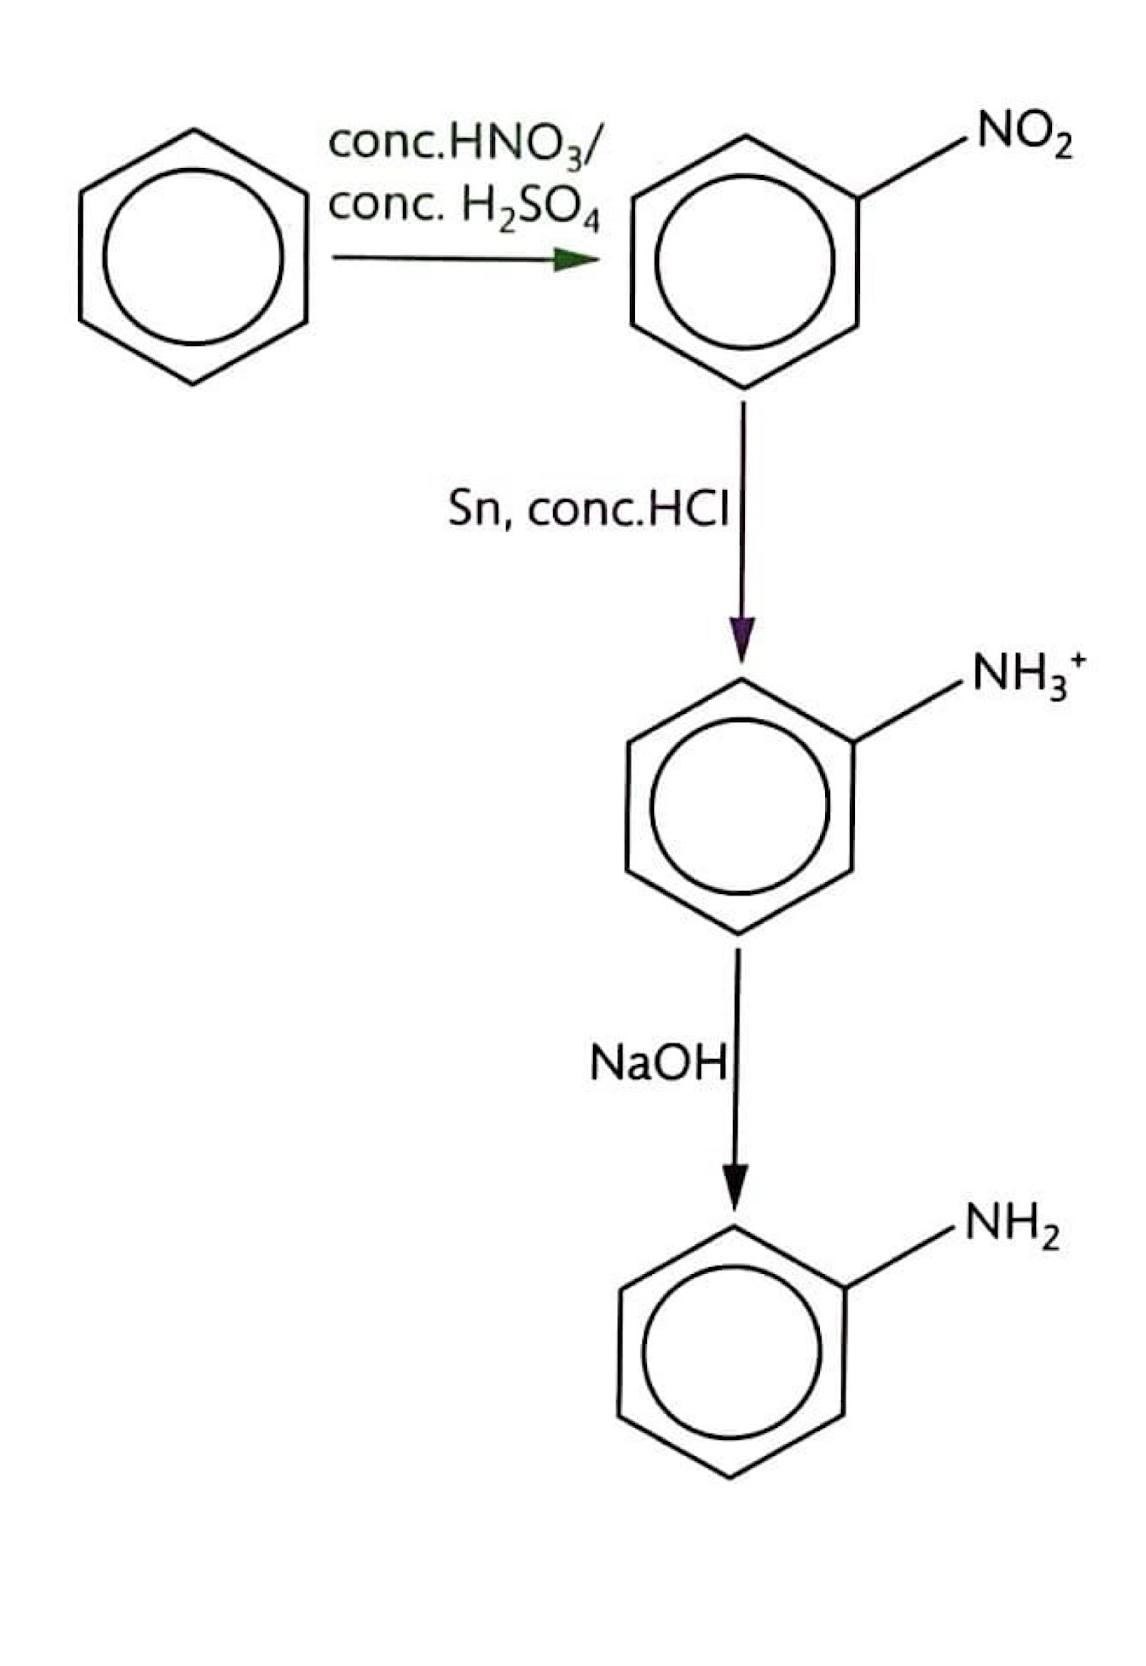
Electrophilic Substitution: Nitration of Benzene

The nitration of benzene is an electrophilic substitution reaction where a hydrogen atom on the benzene ring is replaced by a nitro group (-NO2) to form nitrobenzene. The electrophile in this reaction is the nitronium ion (NO2+), which is generated by mixing concentrated nitric acid and concentrated sulfuric acid at 50°C. Sulfuric acid acts as a catalyst by protonating nitric acid, leading to the formation of the highly electrophilic NO2
Diagram
Diagram
+ ion. This strong electrophile then attacks the benzene ring, forming a carbocation intermediate. Finally, a proton (H+) is lost from the intermediate, which then binds to HSO4
Diagram
- to regenerate the sulfuric acid catalyst, and the aromaticity of the ring is restored.

Reduction Reactions in Organic Chemistry

In organic chemistry, reduction is often characterized by a gain of hydrogen atoms or a loss of oxygen atoms.

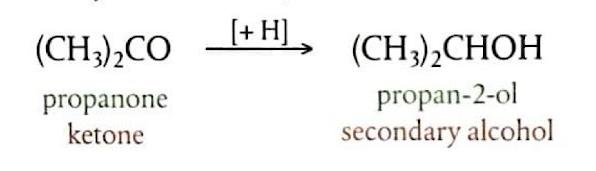
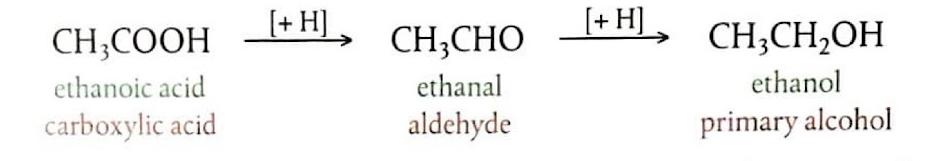
Reduction of Carbonyl Compounds

The reduction of carbonyl compounds is essentially the reversal of oxidation reactions and can be achieved using specific reducing agents. Sodium borohydride (NaBH4) is a common reducing agent used in aqueous or alcoholic solutions. For more powerful reductions, lithium aluminum hydride (LiAlH
Diagram
4) is employed under anhydrous conditions, typically in dry ether followed by aqueous acid workup. Both NaBH4 and LiAlH4 function by producing a hydride ion (H
Diagram
-), which acts as a nucleophile and attacks the electron-deficient carbonyl carbon. It is important to note that the reduction of carboxylic acids with strong reducing agents like LiAlH4 cannot be stopped at the aldehyde stage due to the rapid further reduction of the aldehyde.

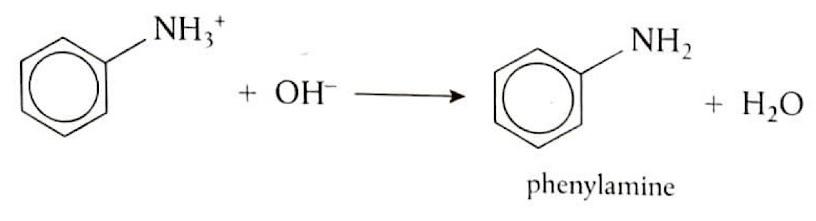
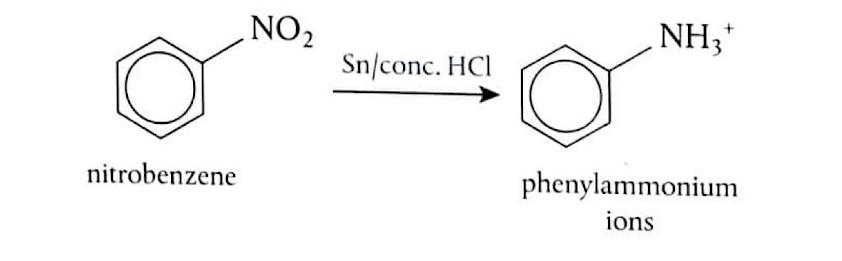
Reduction of Nitrobenzene

Nitrobenzene can be converted into phenylamine through a two-step reduction process. First, nitrobenzene (C6H5NO2) is heated under reflux with tin (Sn) and concentrated hydrochloric acid (HCl). This reaction reduces the nitro group to an amino group, forming phenylammonium ions (C6H5NH3+). In the second step, the phenylammonium ions are treated with a strong base, such as sodium hydroxide (NaOH), to deprotonate the ammonium group and yield phenylamine (C6H5NH2).
Diagram
Diagram
2
Organic Synthesis

The Significance of Organic Synthesis

Organic synthesis plays a pivotal role in numerous fields, most notably in drug design and various industrial applications. It is the cornerstone for creating a vast array of products, including pharmaceuticals, dyes, textiles, and construction materials, which are integral to modern society.
Diagram

Transforming Raw Materials into Useful Compounds

The oil industry serves as the primary source of many fundamental organic compounds. However, these raw materials often require extensive transformation to become useful products. This transformation is achieved through a series of chemical reactions, known as a synthetic route. A synthetic route is essentially a sequence of steps designed to produce a specific organic compound, frequently involving functional group interconversions to achieve the desired molecular structure.
Diagram

Introduction to Retrosynthetic Analysis

Retrosynthesis is a powerful strategy in organic chemistry, developed by E.J. Corey, who was awarded the Nobel Prize in 1990 for his contributions. This approach begins with the target molecule and works backward, conceptually breaking it down into simpler precursor molecules until readily available starting materials are identified. This systematic, backward-thinking method, known as retrosynthetic analysis, is now a fundamental aspect of pharmaceutical research and development. For instance, the synthesis of prostaglandins, a class of important biological compounds, was successfully achieved through the application of retrosynthetic analysis.
3
Stereoisomerism

Defining Isomerism

Isomerism describes compounds that share the same molecular formula but differ in the arrangement of their atoms. This broad category is further divided into structural isomerism and stereoisomerism. Structural isomers have atoms and functional groups connected in different ways, leading to distinct bonding patterns. In contrast, stereoisomers possess the same connectivity but differ in the spatial arrangement of their atoms within the molecule.

Configurational and Conformational Isomerism

Stereoisomerism itself can be categorized into configurational and conformational isomerism. Configurational isomers are distinct spatial arrangements that can only be interconverted by breaking and reforming covalent bonds. This category includes cis-trans, E/Z, and optical isomerism. Conformational isomers, however, can be interconverted simply by free rotation around single (σ) bonds, without the need to break any bonds.

Restricted Rotation and Stereoisomerism

Cis-trans and E/Z isomerism arise in molecules where there is restricted rotation around certain atoms. This restriction prevents the interconversion of different spatial arrangements without bond breaking. There are two primary scenarios where this occurs:
  • Double-Bonded Molecules: In molecules containing a double bond, free rotation is not possible. This is because rotating around the double bond would force the p orbitals out of alignment, thereby breaking the π bond, which requires significant energy. For these molecules, the reference plane for defining isomerism is perpendicular to the sigma bonds and passes directly through the double bond.
  • Cyclic Molecules: The ring structure in cyclic molecules inherently restricts rotation. The atoms within the ring are held in a fixed arrangement, and any attempt to rotate bonds would introduce significant strain, deviating from the ideal tetrahedral bond angles of the parent alkane. The reference plane for cyclic molecules is the plane of the ring itself.

Cis-Trans Isomerism

Cis-trans isomerism is a type of configurational isomerism observed in both double-bonded and cyclic molecules. If two or more different groups are attached to the carbon atoms involved in the double bond or to the carbon atoms within a ring, these groups can be arranged in two distinct ways, leading to two different isomers.
  • Cis Isomers: In a cis isomer, the specified groups are located on the same side of the double bond or the same side of the ring.
  • Trans Isomers: In a trans isomer, the specified groups are located on opposite sides of the double bond or opposite sides of the ring.
Diagram
Diagram
For example, consider 1,2-dibromoethene. In cis-1,2-dibromoethene, both bromine atoms are on the same side of the double bond, while in trans-1,2-dibromoethene, they are on opposite sides. It is important to note that the substituted groups do not necessarily have to be on adjacent carbon atoms to exhibit cis-trans isomerism.
Diagram
Diagram
Diagram

E/Z Isomerism: A More General System

The E/Z naming system is employed for compounds that have more than two different substituents attached to the double-bonded carbons, where the simple cis-trans designation becomes ambiguous. This system is based on the Cahn-Ingold-Prelog rules of priority, which assign a priority to each substituent group. The rules for assigning priority are as follows:
  • Rule 1: The atom directly attached to the double-bonded carbon with the higher atomic number is assigned higher priority.
  • Rule 2: If the directly attached atoms are the same, then the next atoms along the chain are considered until a point of difference is found. Longer hydrocarbon chains generally have higher priority. For example, a propyl group (C3H7) has higher priority than an ethyl group (C2H5), which in turn has higher priority than a methyl group (CH3), and hydrogen (H) has the lowest priority. Similarly, among halogens, bromine (Br) has higher priority than chlorine (Cl), which has higher priority than fluorine (F).
Once priorities are assigned to the two groups on each carbon of the double bond, the E/Z designation is determined:
Diagram
  • Z Isomer: If the two highest priority groups are located on the same side of the double bond, the isomer is designated as Z (from the German "zusammen," meaning together).
  • E Isomer: If the two highest priority groups are located on opposite sides of the double bond, the isomer is designated as E (from the German "entgegen," meaning opposite).
Diagram
It is crucial to remember that the physical properties, such as boiling point, melting point, and solubility, can differ significantly between E and Z isomers, and these properties are typically reported separately for each specific isomer.
Diagram

Optical Isomerism and Chirality

Optical isomerism refers to a type of stereoisomerism found in organic molecules that possess a chiral carbon atom. A chiral carbon atom, also known as an asymmetric carbon or a
stereocenter, is a carbon atom bonded to four different atoms
or groups of atoms. These four groups are arranged tetrahedrally
around the carbon atom, with bond angles of approximately 109.5°.
 The unique arrangement of four different groups around a central carbon allows for two distinct three-dimensional configurations that are non-superimposable mirror images of each other. Such molecules are termed chiral molecules and lack a plane of symmetry. These non-superimposable mirror images are known as optical isomers.
Diagram

Enantiomers and Diastereomers

The non-superimposable mirror images in optical isomerism are specifically called enantiomers. If a mixture contains equal amounts of two enantiomers, it is referred to as a racemic mixture. Molecules can possess more than one chiral center, leading to a greater number of possible stereoisomers. If molecules have different optical configurations at one or more, but not all, of their chiral centers, they are classified as diastereomers. Unlike enantiomers, diastereomers are not mirror images of each other and are also non-superimposable optical isomers. For instance, many sugars are diastereomers of each other. Chiral centers are often indicated with an asterisk (*) for clarity. Interestingly, nearly all amino acids found in biological systems are chiral, but typically only one specific enantiomeric form is utilized.
Diagram
Diagram
Diagram

Properties of Enantiomers

Enantiomers generally exhibit identical physical and chemical properties, with two notable exceptions: their interaction with plane-polarized light and their reactivity with other chiral molecules.

Optical Activity

Enantiomers interact differently with plane-polarized light. When a beam of plane-polarized light (light waves oscillating in a single plane) passes through a solution containing optical isomers, the enantiomers rotate the plane of polarization in opposite directions. A racemic mixture, containing equal amounts of both enantiomers, will not rotate plane-polarized light and is therefore optically inactive, as the rotations cancel each other out. Conversely, chiral molecules existing as a single enantiomer are optically active. An enantiomer that rotates light clockwise is designated as (+) or "d" (dextrorotatory), while one that rotates light counterclockwise is designated as (-) or "l" (levorotatory).
Diagram

Reactivity with Other Chiral Molecules

The second exception to identical properties lies in their reactivity with other chiral molecules. If a racemic mixture is reacted with a single enantiomer of a different compound, the two original enantiomers will react to produce different products. These resulting products will possess distinct chemical and physical properties. This phenomenon is known as resolution and provides a method for separating enantiomers from a racemic mixture. A poignant example of the biological significance of enantiomeric differences is the drug thalidomide, prescribed for morning sickness in the 1960s. One enantiomer of thalidomide was therapeutic, while the other caused severe birth defects. This tragic event underscored the critical importance of stereochemistry in pharmacology and led to advancements in asymmetric synthesis, a process that allows for the production of a single desired enantiomer, often utilizing chiral catalysts.
4
IHD & Mass Spectrometry

Introduction to Mass Spectrometry

Mass spectrometry is a powerful analytical technique primarily employed to determine the molar mass and elemental composition of a chemical compound. The process begins by vaporizing the sample, which is then ionized. The resulting ions are subsequently detected and their masses are graphically represented, providing a unique "fingerprint" of the molecule.
Diagram

Understanding Fragmentation Patterns in Mass Spectrometry

During the ionization process within a mass spectrometer, an electron is typically removed from the molecule through a collision, generating a positive ion. This collision can be sufficiently energetic to cause the molecule to break apart into various smaller fragments. The peak with the highest mass in the spectrum usually corresponds to the parent ion, which is the original molecule that has lost only one electron and remained intact. This parent ion can then further decompose into smaller, detectable ions or fragments. The unique pattern of these fragments, known as the fragmentation pattern, offers valuable structural information about the compound.
Diagram
Diagram
Diagram

Analyzing Fragmentation Patterns: The Example of Ethanol

Consider the possible fragmentation pattern of ethanol. The parent ion for ethanol would have a mass-to-charge ratio (m/z) corresponding to its molar mass. Observing the mass spectrum, one might notice a particularly abundant peak at m/z 31. This peak's high abundance suggests a stable fragment, which in the case of ethanol, corresponds to the CH₂OH⁺ fragment. This fragment is often very stable due to resonance stabilization or the presence of a heteroatom.

Recognizing Common Mass Fragments

Chemists are expected to recognize specific mass fragments that commonly appear in mass spectra. These characteristic fragments are often listed in data booklets, such as Table 28 in the IB Chemistry data booklet, and can be crucial for deducing molecular structures.
Diagram

The Detection of Charged Fragments

It is important to remember that mass spectrometry only detects charged fragments. Neutral fragments, even if formed, will not be registered by the detector. When analyzing the fragmentation of a molecule like pentane, we observe various peaks corresponding to the loss of specific groups. For instance, a peak at M-29 indicates the loss of an ethyl group (C₂H₅), M-15 signifies the loss of a methyl group (CH₃), M-43 corresponds to the loss of a propyl group (C₃H₇), and M-57 represents the loss of a butyl group (C₄H₉).
Diagram

Isotopic Peaks in Mass Spectrometry

The presence of molecular isotopes leads to characteristic groupings of peaks in a mass spectrum. For example, the M+1 peak, which is one mass unit higher than the parent ion peak, is primarily due to the natural abundance of the carbon-13 isotope (¹³C). Similarly, M+2 peaks can arise from the presence of isotopes like oxygen-18 (¹⁸O) or chlorine-37 (³⁷Cl). These isotopic patterns provide further clues about the elemental composition of the molecule. In the fragmentation analysis of pentane, for example, peaks such as M-57, M-43, M-29, M-15, and the parent ion M-72 (representing the molecular ion) would be observed, each potentially accompanied by smaller isotopic peaks.
Diagram

Determining Molecular Formula from Mass Spectrum Data

The mass spectrum can be used to determine the molecular formula of a compound. If the empirical formula is known, for example, CH₂O, the molecular formula can be expressed as CₙH₂ₙOₙ. By calculating the empirical formula mass (Mᵣ) as n(12.01) + 2n(1.01) + n(16.00) = 30.03n, and knowing the molecular ion peak (Mᵣ) from the mass spectrum (e.g., Mᵣ = 60), we can solve for 'n'. In this case, 60 = 30.03n, which gives n ≈ 2. Therefore, the molecular formula is C₂H₄O₂.

Determining Molecular Structure from Mass Spectrum Data

Determining the molecular structure from a mass spectrum involves a systematic approach.
Diagram
  1. Step 1: Identify the formula of peak fragments. The parent ion peak provides the molecular formula (e.g., 60 m/z for C₂H₄O₂). Other significant peaks correspond to fragments. For instance, a peak at 45 m/z could represent COOH⁺, resulting from the loss of a CH₃ group (60 - 15). A peak at 43 m/z, while not always explicitly identified in standard IB booklets, could indicate the loss of an OH group (60 - 17), suggesting a C₂H₃O⁺ fragment. A peak at 15 m/z typically corresponds to a CH₃⁺ fragment, resulting from the loss of a COOH group from the parent.
  2. Step 2: Identify the structure of smaller peak fragments. Based on their m/z values and common fragmentation patterns, assign plausible structures to the observed fragments.
  3. Step 3: Combine fragmentation structures to determine the parent structure. By piecing together the identified fragments and considering how they could have originated from the parent molecule, the overall molecular structure can be deduced.


The Concept of Degree of Unsaturation (IHD)

The degree of unsaturation, also known as the index of hydrogen deficiency (IHD), is a crucial concept in organic chemistry. It quantifies the number of molecules of H₂ that would be required to convert a given organic molecule into its corresponding saturated, non-cyclic form. This value provides valuable insights into the presence of rings or multiple bonds (double or triple bonds) within a molecule once its molecular formula is known.

IHD Values for Different Bond Types

The IHD value directly relates to the type of bonds or rings present in a molecule. A single bond contributes an IHD of 0, meaning it is fully saturated with respect to hydrogen. A double bond, however, reduces the number of hydrogens by two compared to a saturated equivalent, thus contributing an IHD of 1. Similarly, a triple bond, which reduces hydrogens by four, contributes an IHD of 2. Each ring in a cyclic compound also contributes an IHD of 1.
Type of Bond IHD Value
Single 0
Double 1
Triple 2
Diagram

Calculating IHD Values for Various Molecules

The IHD can be calculated using the molecular formula. For a general formula CₓHᵧNₐOᵦX𝛄 (where X is a halogen), the IHD is given by the formula: IHD = x + 1 - (y/2) + (a/2) - (𝛄/2). Let's apply this to several examples:
Molecule Structure Corresponding saturated non-cyclic molecule IHD
C₆H₆ Benzene (or other isomers) C₆H₁₄ 4
CH₃COCH₃ Propanone C₃H₈O 1
C₇H₆O₂ Benzoic acid (or other isomers) C₇H₁₆O₂ 5
C₂H₃Cl Chloroethene C₂H₅Cl 1
C₄H₉N Butylamine (or other isomers) C₄H₁₁N 0
C₆H₁₂O₆ Glucose (or other isomers) C₆H₁₄O₆ 1
Diagram
Diagram
Diagram

Electromagnetic Spectrum and Molecular Structure Analysis

Spectroscopy is a broad field that investigates the interaction between matter and electromagnetic radiation, commonly referred to as light. Light can be conceptualized as both waves of energy and discrete packets of energy called photons. Key properties of light waves include wavelength (𝝺), which is the distance between successive wave crests, and frequency (𝝂), which represents the number of waves passing a point per second. Different regions of the electromagnetic spectrum, characterized by their distinct frequencies and wavelengths, interact with molecules in unique ways, providing various types of structural information.
Type of electromagnetic radiation Typical frequency (s⁻¹) Typical wavelength (m)
radio waves 3×10⁶ 10²
microwaves 3×10¹⁰ 10⁻²
infrared 3×10¹² 10⁻⁴
visible 3×10¹⁵ 10⁻⁷
ultraviolet 3×10¹⁶ 10⁻⁸
X rays 3×10¹⁸ 10⁻¹⁰
gamma rays Greater than 3×10²² Less than 10⁻¹⁴
5
Infrared (IR) Spectroscopy

The Vibrational Nature of Chemical Bonds

A chemical bond can be conceptualized as a spring, possessing inherent vibrational and bending motions. Each bond within a molecule vibrates and bends at a characteristic natural frequency, which is determined by both the bond's strength and the masses of the atoms involved. Lighter atoms, for instance, tend to vibrate at higher frequencies compared to heavier atoms. Similarly, multiple bonds, such as double or triple bonds, exhibit higher vibrational frequencies than single bonds. The unique wavenumbers at which these bonds absorb energy allow for their identification through infrared (IR) spectroscopy. These molecular motions can be broadly categorized into stretching, where the bond length changes, and bending, where the bond angle changes. Wavenumber, often expressed as the number of waves per centimeter (cm-1), is a common unit used in IR spectroscopy to describe the frequency of absorbed radiation.
Diagram

Interaction of Molecules with Infrared Radiation

In simple diatomic molecules, such as HCl, HBr, and HI, the only possible vibrational motion is stretching. Among these, the HCl bond exhibits the highest vibrational frequency because chlorine is the lightest of the three halogens. More complex molecules, however, display various types of vibrations, including bending motions. The energy required to excite these molecular bonds, causing them to vibrate with greater amplitude, falls within the infrared region of the electromagnetic spectrum. Crucially, only polar molecules will interact with IR radiation; nonpolar molecules, lacking a permanent dipole moment, cannot effectively interact with an oscillating electric field. Polar molecules possess partial positive and negative charges that fluctuate as their vibrational energy changes upon absorbing IR radiation. This change in dipole moment is what makes a vibration "IR active," leading to absorption.
Diagram

Interpreting an IR Spectrum: Ethanol Example

An IR spectrum, such as that for ethanol, typically displays transmittance on the y-axis and wavenumber (cm-1) on the x-axis. It's important to note that the x-axis is often non-linear. A 100% transmittance value indicates no IR absorption at that particular wavenumber. Different "bands" or peaks in the spectrum correspond to the absorption of IR radiation by specific chemical bonds within the molecule.
Diagram

Vibrational Modes in Polyatomic Molecules

When considering polyatomic molecules, it is more accurate to view the stretching and bending motions as collective vibrations of the entire molecule rather than isolated movements of individual bonds. For example, water (H2O) exhibits three distinct vibrational modes that are detectable by IR radiation: a symmetric stretch, an asymmetric stretch, and a symmetric bend. All three of these modes are "IR active" in water, meaning they result in a change in the molecule's dipole moment and thus absorb IR radiation.
Diagram

Carbon Dioxide Vibrational Modes

Carbon dioxide (CO2), despite being a linear molecule, also exhibits several vibrational modes.

Factors Affecting IR Absorption Bands

The precise position of an IR absorption band is highly dependent on the chemical environment of the bond. For instance, while C-C single bonds generally do not produce strong IR absorption bands due to their low polarity and often symmetrical environment, certain C-C bonds within a molecule might show absorption if their vibration leads to a change in the molecule's dipole moment. Information regarding typical IR absorption bands can be found in Table 26 of the IB Data Booklet. It is also important to note that hydrogen bonding can significantly affect IR spectra, causing absorption bands to broaden and shift to lower frequencies.
Diagram

IR Absorption Range and Bond Identification

The absorption of specific wavenumbers of IR radiation is a powerful tool for chemists to identify the types of bonds present within a molecule.
Diagram

Characteristics of IR Peaks

Certain bonds can be identified by the distinctive shape of their signals in an IR spectrum. For example, the O-H stretch typically produces a broad signal due to hydrogen bonding, whereas the C=O stretch usually results in a sharp signal. IR spectroscopy is a valuable technique for identifying compounds, particularly when comparing an unknown sample to a known standard. By comparing the IR spectrum of an unknown sample to that of a known compound, one can determine if the two substances are identical.
Diagram
Diagram

The Fingerprint Region in IR Spectroscopy

While the entire IR spectrum can serve as a unique "fingerprint" for molecular identification, the region between 600 and 1400 cm-1 is specifically designated as the "fingerprint region." This area is typically complex, characterized by numerous, often overlapping bands. This complexity limits its utility for beginners in spectrum analysis, primarily serving as a unique identifier when comparing spectra. For students, it is generally advisable to focus analysis on the region to the left of 1400 cm-1, where characteristic functional group absorptions are more easily identified.
Diagram
6
¹H-NMR Spectroscopy

Nuclear Magnetic Resonance Spectroscopy Fundamentals

Nuclear Magnetic Resonance (NMR) spectroscopy is a powerful analytical technique employed to elucidate the chemical environment of specific isotopes within a molecule, such as 1H, 13C, 19F, and 31P. This method is invaluable for determining the structure and three-dimensional shape of molecules. The fundamental principle behind NMR relies on the intrinsic property of atomic nuclei with an odd number of neutrons to possess nuclear spin, causing them to behave like minuscule bar magnets.

NMR Energy Levels and Resonance

Diagram

When these spinning nuclei are subjected to an external magnetic field, they align themselves in one of two possible orientations: either with the applied field or against it, corresponding to two distinct nuclear energy levels. Radio waves, when supplied at the precise frequency, can provide the necessary energy to induce these nuclei to reverse their spin orientation, transitioning from a lower energy state to a higher one. This phenomenon is known as resonance.

In an NMR spectrometer, the sample is placed within a strong electromagnet. The strength of this magnetic field is systematically varied until the radio waves achieve the exact frequency required to cause the nuclei to "flip" their spin. This resonance condition can be electronically detected and subsequently recorded as a spectrum.

Diagram

1H-NMR Spectroscopy: Chemical Shifts and Information Content

In 1H-NMR spectroscopy, the electrons surrounding a nucleus partially shield it from the full effect of the external magnetic field. Different electron distributions, arising from varying chemical environments, lead to different energy separations between the spin levels. Consequently, protons (1H nuclei) in distinct chemical environments within a molecule will absorb radio waves at slightly different frequencies, producing unique signals in the NMR spectrum. These signals provide crucial information about the atomic positions within the molecule.

Diagram

To standardize these measurements, the positions of sample peaks are compared to a reference compound, tetramethylsilane (TMS). The difference in absorption frequency relative to TMS is termed the "chemical shift."

A 1H-NMR spectrum provides several key pieces of information:

Diagram
Diagram
Diagram
  • The number of distinct resonance signals directly corresponds to the number of different (non-equivalent) hydrogen atoms present in the molecule.
  • The integration of the peak areas, often represented by "steps" on the spectrum, is proportional to the relative number of hydrogen atoms responsible for that particular resonance.
  • The chemical shift value (δ) for each signal reveals the electronic bonding environment of the corresponding hydrogen atoms.


Diagram

Analyzing a 1H-NMR Spectrum: 

Diagram

Let's consider an example of analyzing a 1H-NMR spectrum for a compound with the molecular formula C3H8O. The spectrum would typically show a TMS standard peak at 0 ppm. Other characteristic chemical shifts might indicate the presence of functional groups such as a methyl group (—CH3), a methylene group adjacent to an alkyl chain (—CH2R), a hydroxyl proton (R–O–H), or a methylene group adjacent to an oxygen atom (R–O–CH2–). By interpreting these signals and their integrations, the resulting structure of the compound can be deduced.

Combining Analytical Techniques for Structure Elucidation

Often, a combination of analytical methods is employed to obtain the most comprehensive structural information about a compound. This multi-technique approach typically involves:

Diagram
Diagram
  1. Deducing the empirical formula of the compound.
  2. Using mass spectrometry to determine the molecular formula and the Index of Hydrogen Deficiency (IHD), which indicates the number of rings and/or double bonds.
Diagram

Finally, the molecular structure is deduced by interpreting the infrared (IR) spectrum, which identifies functional groups, and
the 1H-NMR spectrum, which provides detailed information
about the hydrogen atom environments.


Diagram

The Role of Tetramethylsilane (TMS) as a Reference Standard

Diagram

Tetramethylsilane (TMS) serves as the universal reference standard in 1H-NMR spectroscopy. It produces a single, sharp signal because all twelve hydrogen atoms in TMS are chemically equivalent, residing in identical chemical environments. A significant advantage of TMS is that its signal typically does not overlap with signals from most organic compounds, as it absorbs radio waves in a distinct region of the spectrum. This is partly due to silicon having a lower electronegativity than carbon, which results in the protons in TMS being highly shielded.

The chemical shift (δ) of a proton in a molecule is defined by the following equation:

δ = (ν - ν0) / ν0 × 106 ppm

Where:

  • ν is the frequency of radio waves absorbed by the protons in the sample.
  • ν0 is the frequency of radio waves absorbed by the protons in TMS.

This ratio ensures that the chemical shift relative to the standard remains constant regardless of the spectrometer's operating frequency.

Benefits of Using TMS

TMS is an ideal reference standard due to several beneficial properties:

  • It is chemically inert, meaning it does not react with the sample.
  • It is soluble in most organic solvents, making it compatible with a wide range of samples.
  • It has a low boiling point, allowing for its easy removal from the sample after analysis.

High-Resolution 1H-NMR Spectroscopy and Spin-Spin Coupling

While low-resolution 1H-NMR spectra often display single peaks, high-resolution 1H-NMR spectra reveal that many of these peaks are actually split into multiple smaller peaks. This phenomenon, known as spin-spin coupling, occurs due to the influence of the magnetic fields of neighboring protons on each other.

The local magnetic field experienced by a proton is slightly altered by the magnetic fields of adjacent protons. If a neighboring proton's magnetic field aligns with the external magnetic field, the local field experienced by the observed proton is increased. Conversely, if the neighboring proton's magnetic field aligns against the external field, the local field is decreased. This results in different energy differences (ΔE) between the spin states of the observed proton, leading to the splitting of its signal.

For instance, in ethanal (CH3CHO), the magnetic fields of the methyl (CH3) protons modify the magnetic field experienced by the aldehyde (CHO) proton, and vice versa. This interaction causes the CHO proton's signal to split into a quartet (four signals) due to the three neighboring CH3 protons, and the CH3 protons' signal to split into a doublet (two signals) due to the single neighboring CHO proton.

Diagram

Splitting of Energy Levels Due to Neighboring Protons

The energy difference (ΔE) between the spin states of a proton is affected by the alignment of neighboring protons. If a neighboring proton's magnetic field aligns with the external field, the energy difference (ΔEa) for the observed proton is slightly different than if the neighboring proton's magnetic field aligns against the external field (ΔEn). Consequently, a single peak observed in a low-resolution spectrum can resolve into a doublet in a high-resolution spectrum due to the influence of a single proton on an adjacent carbon atom.

Splitting Patterns: Influence of -CH3 and -CH2 Protons

Diagram

The splitting pattern observed in a high-resolution 1H-NMR spectrum is determined by the number of chemically equivalent protons on adjacent carbon atoms. For example, neighboring -CH3 protons, with their various spin combinations, produce magnetic fields that split the NMR peak of an adjacent proton. The relative intensities of the peaks in a quartet, caused by three equivalent neighboring protons, are 1:3:3:1.

Diagram

Similarly, when a proton is adjacent to a -CH2 group, the two neighboring protons can have different spin combinations, leading to a triplet splitting pattern with relative intensities of 1:2:1. This arises from the following possibilities for the alignment of the two neighboring protons:

Both protons aligned with external magnetic field One proton aligned with and one against external magnetic field Both protons aligned against external magnetic field

Summary of 1H-NMR Splitting Rules

Several key rules govern the splitting patterns observed in 1H-NMR spectroscopy:

  • Protons bonded to the same atom generally do not interact with each other and are considered to behave as a group.
  • Protons on non-adjacent carbon atoms typically do not exhibit significant spin-spin coupling.
  • The O-H single peak in ethanol, for instance, usually does not split unless the sample is exceptionally pure. This is because the rapid exchange of protons between ethanol molecules averages out the spins, effectively decoupling them.
  • The "n+1 rule" states that for a proton with 'n' chemically equivalent protons as its nearest neighbor(s), its NMR peak will be split into (n + 1) peaks. The relative intensities of these peaks follow Pascal's triangle.
# of chemically equivalent protons causing splitting Splitting patterns with relative intensities
0 1
1 1 1
2 1 2 1
3 1 3 3 1
4 1 4 6 4 1
8
X-Ray Diffraction

Introduction to X-Ray Diffraction

When X-rays, which possess wavelengths on the order of 10⁻⁹ meters, are directed through a crystalline solid, they interact with the electrons present within the substance. This interaction causes the X-rays to be scattered in a highly ordered manner. The scattered waves subsequently interfere with one another, leading to the formation of a distinct diffraction pattern. This phenomenon of interference can manifest in two primary ways: constructive interference, where waves are in phase and reinforce each other, or destructive interference, where waves are out of phase and effectively cancel each other out.
Diagram
Diagram
Diagram

Characteristics of Diffraction Patterns

For a clear and ordered diffraction pattern to be observed, the sample under investigation must be in the solid state. As the scattered X-ray waves reach the detector, they are at different phases, which is dependent on their wavelength. The resulting diffraction pattern is critically dependent on the relationship between several key parameters: the angle of incidence (𝚹) of the X-rays, the wavelength of the incident X-rays (𝛌), and the distance between and relative orientations of the atoms (d) within the crystal lattice.

Determining Molecular Structure from Diffraction Data

From the intricate diffraction pattern, an electron density map of the molecule can be meticulously constructed. This map provides crucial information, as the identity of individual atoms can be inferred from their electron density, which is directly related to their electron configurations. It is important to note, however, that hydrogen atoms are typically not visible in these maps due to their extremely low electron density. X-ray diffraction is an invaluable technique employed to identify the molecular structures of both organic and inorganic biochemical compounds. Furthermore, precise bond lengths and angles within a molecule can be accurately determined from the electron density map. Regions exhibiting high electron density between atoms are indicative of the presence of covalent bonds. An example of an electron density map, such as that for anthracene, often features contour lines that connect points of equal electron density, providing a visual representation of electron distribution.
Diagram