IB Chemistry Study Summary

Kinetics

1
Reaction Rates & Collision Theory

Understanding the Rate of Reaction

The rate of a chemical reaction quantifies how quickly the concentrations of reactants change or how rapidly products are formed over a specific period. This dynamic process is typically visualized through graphs that plot concentration against time. Essentially, the reaction rate describes the speed at which a chemical transformation proceeds. Mathematically, it can be expressed as the change in product concentration (Δ[P]) or the negative change in reactant concentration (-Δ[R]) over a given time interval. The standard units for reaction rate are moles per cubic decimeter per second (mol dm-3 s-1).
Diagram
Diagram

The Foundation of Collision Theory

Collision theory provides a fundamental explanation for how chemical reactions occur at the molecular level. It is rooted in the kinetic-molecular theory of matter, which posits that all particles are in constant, random motion due to their inherent kinetic energy. For a reaction to take place, particles must collide with sufficient kinetic energy, specifically exceeding a minimum threshold known as the activation energy, and possess the correct spatial orientation, or collision geometry. Kinetic energy is directly related to the absolute temperature (measured in Kelvin) of a substance, representing the average kinetic energy of its constituent particles. Consequently, increasing the temperature of a substance elevates the average kinetic energy of its particles.
Diagram

The Maxwell-Boltzmann Distribution of Kinetic Energies

The Maxwell-Boltzmann distribution curve is a graphical representation illustrating that particles within a gas at a particular temperature do not all possess the same kinetic energy; instead, they exhibit a range of kinetic energy values. The total area enclosed beneath this curve corresponds to the total number of particles present in the sample.
Diagram

Heat Content vs. Temperature: An Iceberg and Coffee Analogy

Consider the intriguing phenomenon that an iceberg, despite its low temperature, contains more heat energy than a cup of boiling coffee. This can be explained by understanding the difference between temperature and heat content. Temperature is a measure of the average kinetic energy of the particles, while heat content is the total internal energy of a substance, which depends on both the average kinetic energy and the number of particles. An iceberg, being vastly larger than a cup of coffee, contains an immense number of water molecules. Even though the average kinetic energy of these molecules (and thus the temperature) is low, the sheer quantity of molecules means the total sum of their kinetic and potential energies (the heat content) is significantly greater than that of the much smaller volume of boiling coffee, which has a high average kinetic energy but far fewer molecules.

The Mechanics of Chemical Reactions

Chemical reactions are initiated by the kinetic energy of reactant particles, which leads to collisions. These collisions, if successful, result in the breaking of existing bonds and the formation of new ones, ultimately yielding products. The rate at which a reaction proceeds is directly dependent on the number of "successful collisions." It is crucial to understand that not all collisions are effective in bringing about a reaction. The success of a collision hinges on two critical factors: the energy of the collision and the geometry of the collision.
Diagram

The Energetic Requirement for Collision Success

For a chemical reaction to occur, colliding particles must possess a minimum amount of kinetic energy, known as the activation energy (Ea). This activation energy is essential for overcoming the repulsive forces between molecules and for breaking the existing bonds within the reactant molecules. The input of activation energy allows the reactants to reach a high-energy, unstable intermediate state called the transition state, from which products can then form. Consequently, only those particles with kinetic energies equal to or greater than the activation energy will participate in successful collisions that lead to product formation. Other particles may still collide, but their collisions will be ineffective and will not contribute to the overall progression of the reaction. The activation energy, therefore, represents the minimum kinetic energy required for particles to react.

Factors Influencing Activation Energy and Reaction Rate

Activation energies are not constant; they vary significantly from one chemical reaction to another. The rate of a reaction is intrinsically linked to the proportion of particles that possess kinetic energy exceeding the activation energy. A higher activation energy implies that a smaller fraction of particles will have the necessary energy to react, leading to a slower reaction rate. Conversely, lower activation energies generally correspond to faster reactions.
Diagram
Diagram

The Importance of Collision Geometry

It is important to remember that particle collisions occur randomly, meaning they can happen with a multitude of different orientations. The specific geometry, or spatial arrangement, of the colliding particles is a crucial determinant of whether a collision will be successful and, consequently, the proportion of collisions that effectively lead to a chemical reaction. For a reaction to proceed, the reactant molecules must collide in an orientation that allows for the proper alignment of atoms and the formation of new bonds.
Diagram
2
Factors Affecting Reaction Rates

Factors Influencing Reaction Rates

The rate at which a chemical reaction proceeds is influenced by several key factors. Generally, an increase in temperature, concentration, or pressure (for gases), or a decrease in particle size, will lead to a faster reaction rate. The addition of a catalyst also significantly accelerates reaction rates. Fundamentally, any factor that increases the frequency of successful collisions between reactant particles will result in an increased reaction rate.

The Impact of Temperature on Reaction Rate

Diagram

Increasing the temperature of a reaction mixture directly increases the average kinetic energy of the reactant particles. This elevation in kinetic energy means that a greater proportion of particles will possess kinetic energy equal to or exceeding the activation energy (Ea) required for a successful reaction. Consequently, more effective collisions occur per unit time, leading to an accelerated reaction rate.

The Role of Concentration in Reaction Kinetics

Diagram

For reactions occurring in solution or involving gases, increasing the concentration of reactants means there are more reactant particles present in a given volume. This higher density of particles leads to a greater frequency of collisions between them. A higher collision frequency, in turn, increases the likelihood of successful collisions, thereby accelerating the reaction rate.

Diagram

Surface Area and Particle Size Effects

When solid reactants are involved, decreasing their particle size significantly increases the total surface area exposed to other reactants. A larger surface area provides more sites for collisions to occur, thus increasing the frequency of effective collisions and accelerating the reaction rate. Similarly, for gaseous reactions, increasing the pressure forces gas particles closer together, effectively increasing their concentration. This leads to a higher frequency of collisions and, consequently, a faster reaction rate.

Catalysis and Activation Energy

Diagram

A catalyst enhances the rate of a chemical reaction by providing an alternative reaction pathway with a lower activation energy (Ea). By lowering the energy barrier, a larger fraction of reactant particles at a given temperature will possess sufficient kinetic energy to overcome the activation energy. It is crucial to remember that catalysts are not consumed
in the overall reaction; they participate in the reaction mechanism
but are regenerated at the end. Furthermore, catalysts decrease
theactivation energy for both the forward and reverse reactions
equally, thus not affecting the position of equilibrium but only the
rate at which equilibrium is achieved.

Diagram

Summary of Factors Affecting Reaction Rates

Factor Effect on Reaction Rate Explanation
Temperature Increases Increases average kinetic energy, leading to more particles with E ≥ Ea.
Concentration Increases Increases frequency of collisions between reactant particles.
Particle Size Decreases (for solids) Increases surface area for collisions.
Pressure Increases (for gases) Increases concentration of gas particles, leading to more collisions.
Catalyst Increases Provides an alternative reaction pathway with lower activation energy.
Diagram
3
Measuring Reaction Rates

Experimental Determination of Reaction Rates

The rate of a chemical reaction can be experimentally determined by monitoring the change in concentration of either reactants or products over time. While direct measurement of concentration in mol dm-3 is ideal, many experimental techniques rely on observing changes in other physical parameters that are directly proportional to concentration changes. These parameters can include the volume of gas produced, the mass lost from the reaction system, or changes in the color intensity of the solution. Consequently, the raw data collected may be in various units other than mol dm-3. Modern data-logging devices are frequently employed to automate and improve the precision of these measurements.

Diverse Methods for Measuring Reaction Rates

A variety of experimental methods are available to measure reaction rates, each suited to different types of chemical reactions. These methods include monitoring the change in volume of gas produced, observing the change in mass of the reaction system, measuring the transmission of light using techniques like colorimetry or spectrophotometry, determining concentration changes through titration, assessing conductivity changes, and utilizing "clock reactions" which measure the time to a specific endpoint.
Diagram

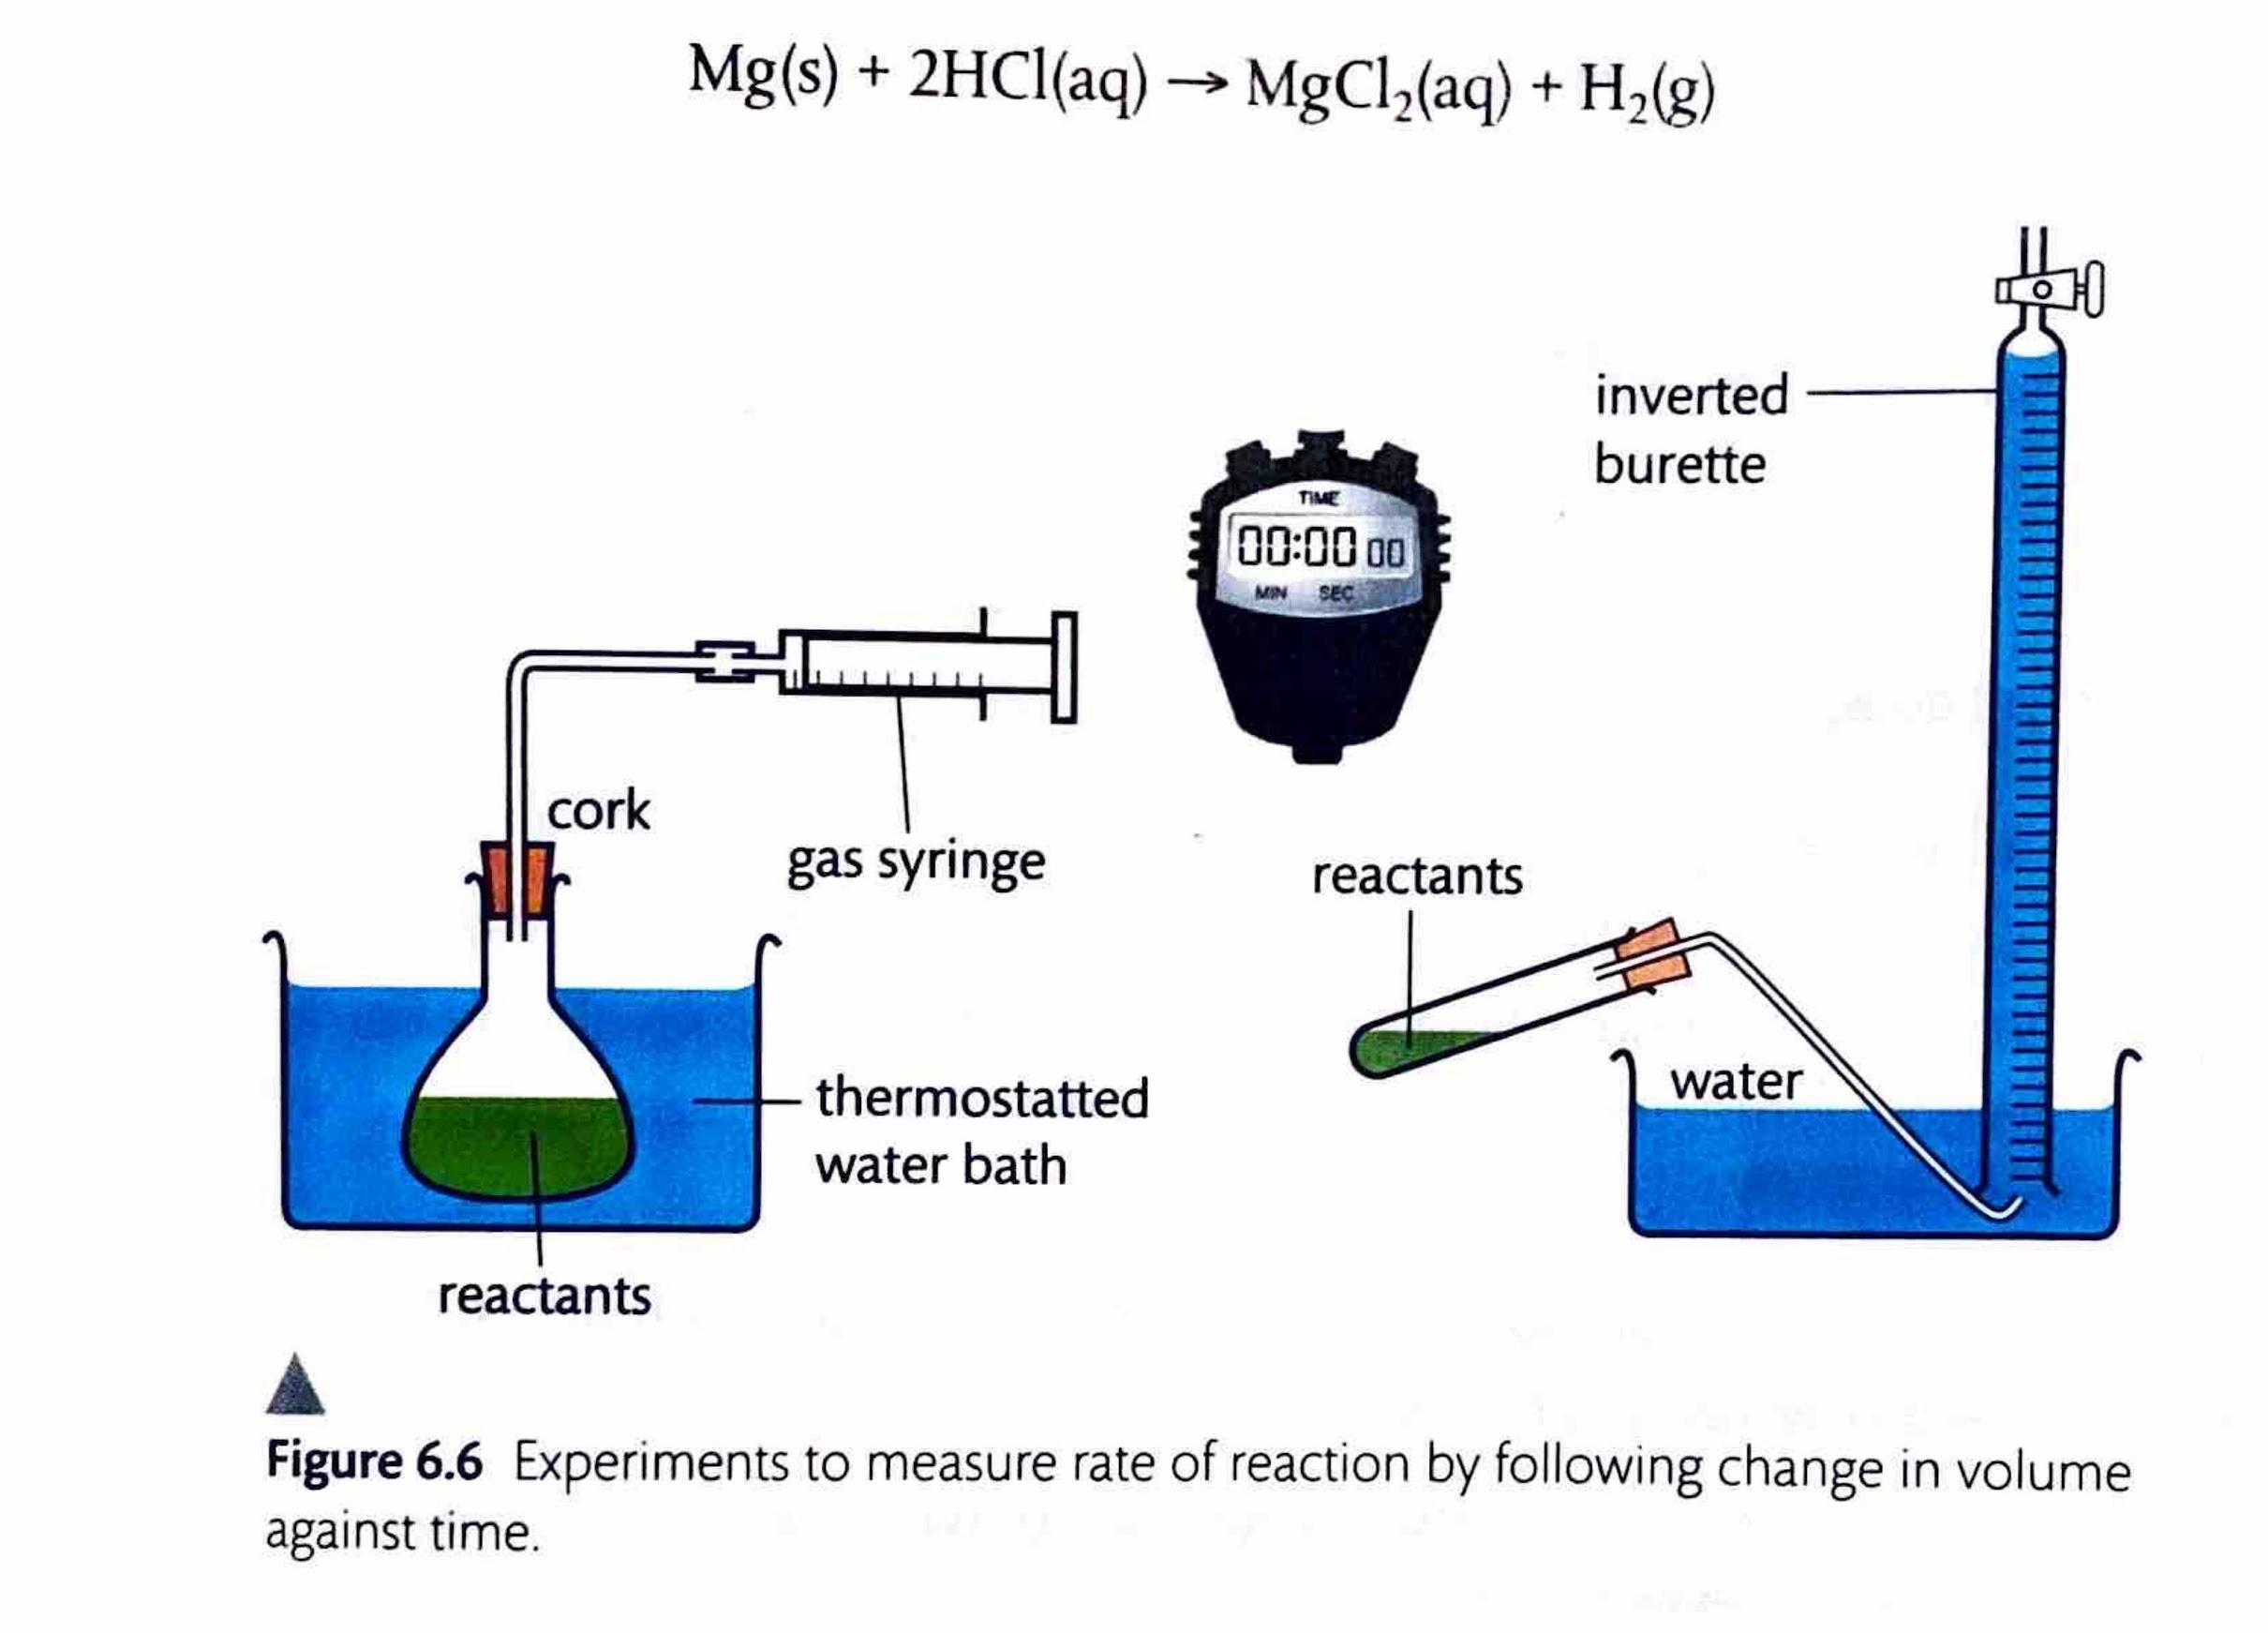
Measuring Rate by Change in Gas Volume

When one of the products of a reaction is a gas, measuring the change in its volume provides a convenient way to determine the reaction rate. A gas syringe is commonly used to collect the gas produced, allowing for direct measurement of its volume over time. Alternatively, the gas can be collected by the displacement of water, where the volume of displaced water corresponds to the volume of gas produced.
Diagram

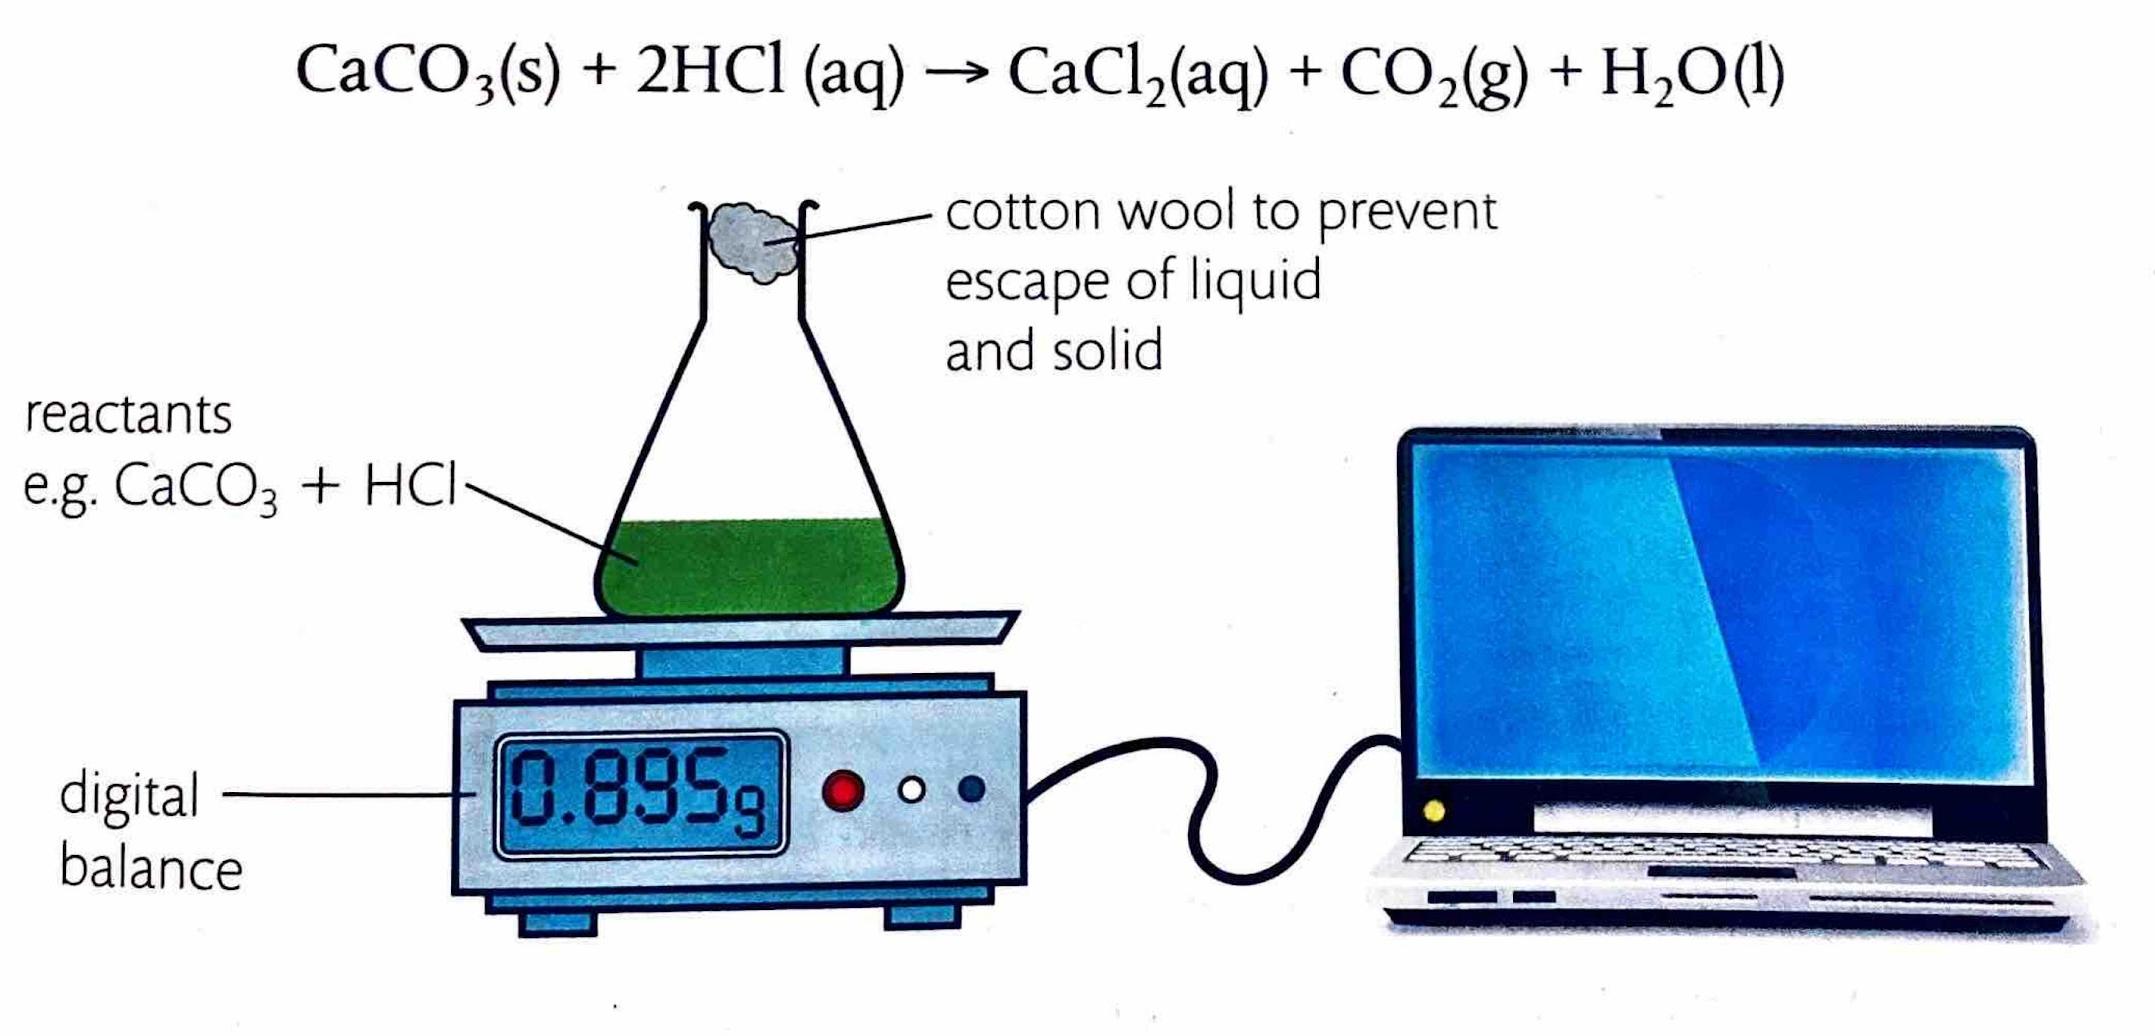
Measuring Rate by Change in Mass

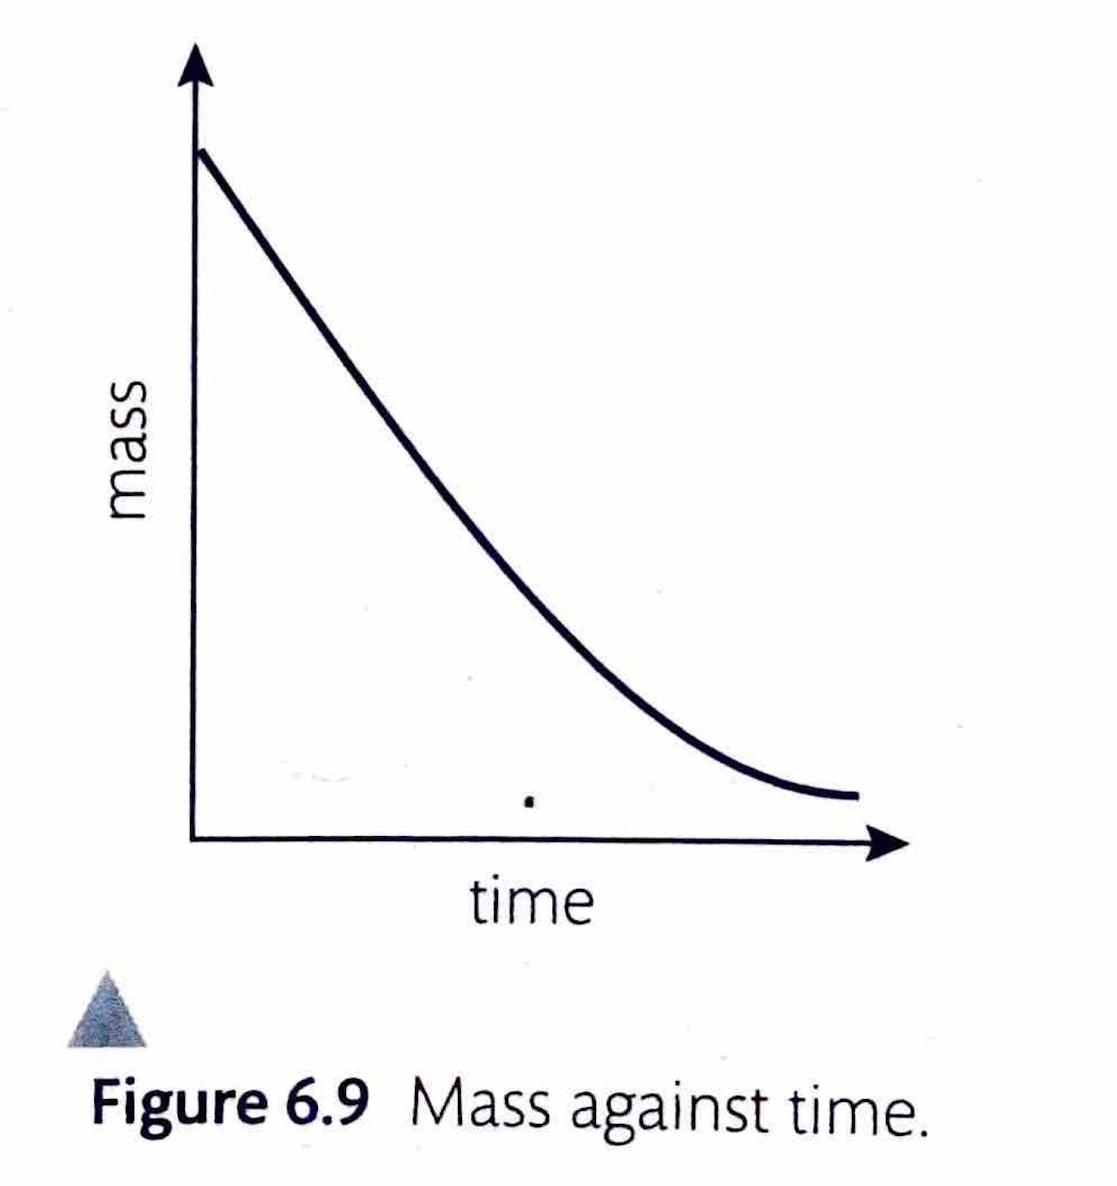
If a reaction produces a gaseous product, the rate can be determined by measuring the decrease in the total mass of the reaction mixture over time. This is typically achieved by placing the reaction vessel on a balance. This method is particularly effective when small molar-mass gases, such as hydrogen (H
Diagram
2) or carbon dioxide (CO2), are evolved, as their escape leads to a more significant and easily measurable mass change.
Diagram
Diagram

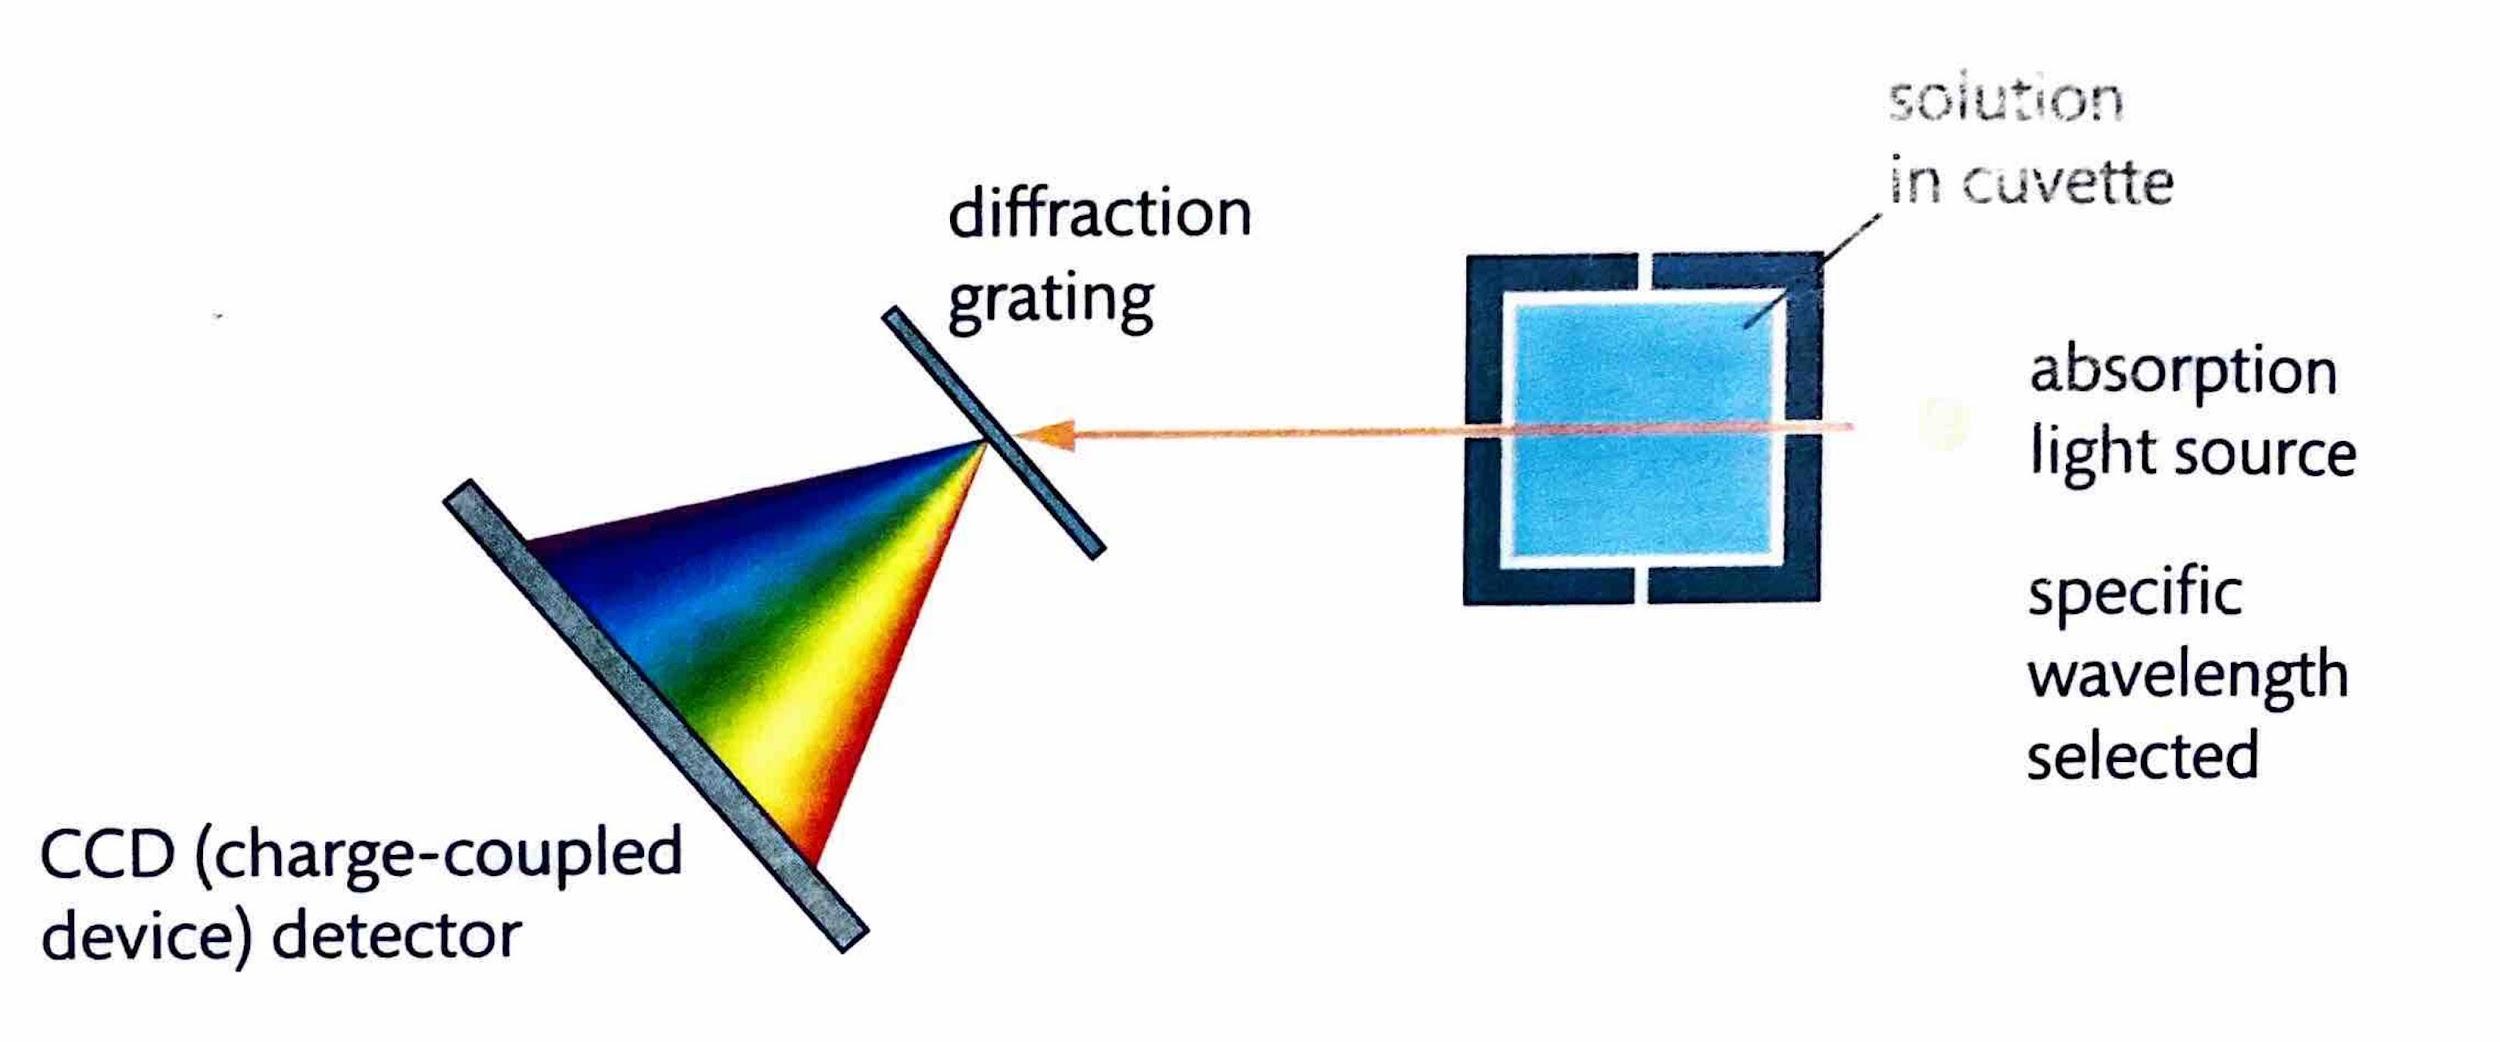
Measuring Rate by Change in Light Transmission

The rate of a reaction can be monitored by observing changes in the transmission of light through the reaction mixture, provided that one of the reactants or products is colored, or if a color indicator can be used. Colored compounds absorb light in the visible region of the electromagnetic spectrum. A colorimeter or spectrophotometer works by passing specific wavelengths of light through the solution and measuring the amount of light that is transmitted. As the concentration of a colored compound increases, its light absorbance proportionally increases, leading to a decrease in the amount of transmitted light. This technique allows for continuous readings, enabling the creation of a graph of absorbance (or transmittance) versus time, from which the reaction rate can be determined.

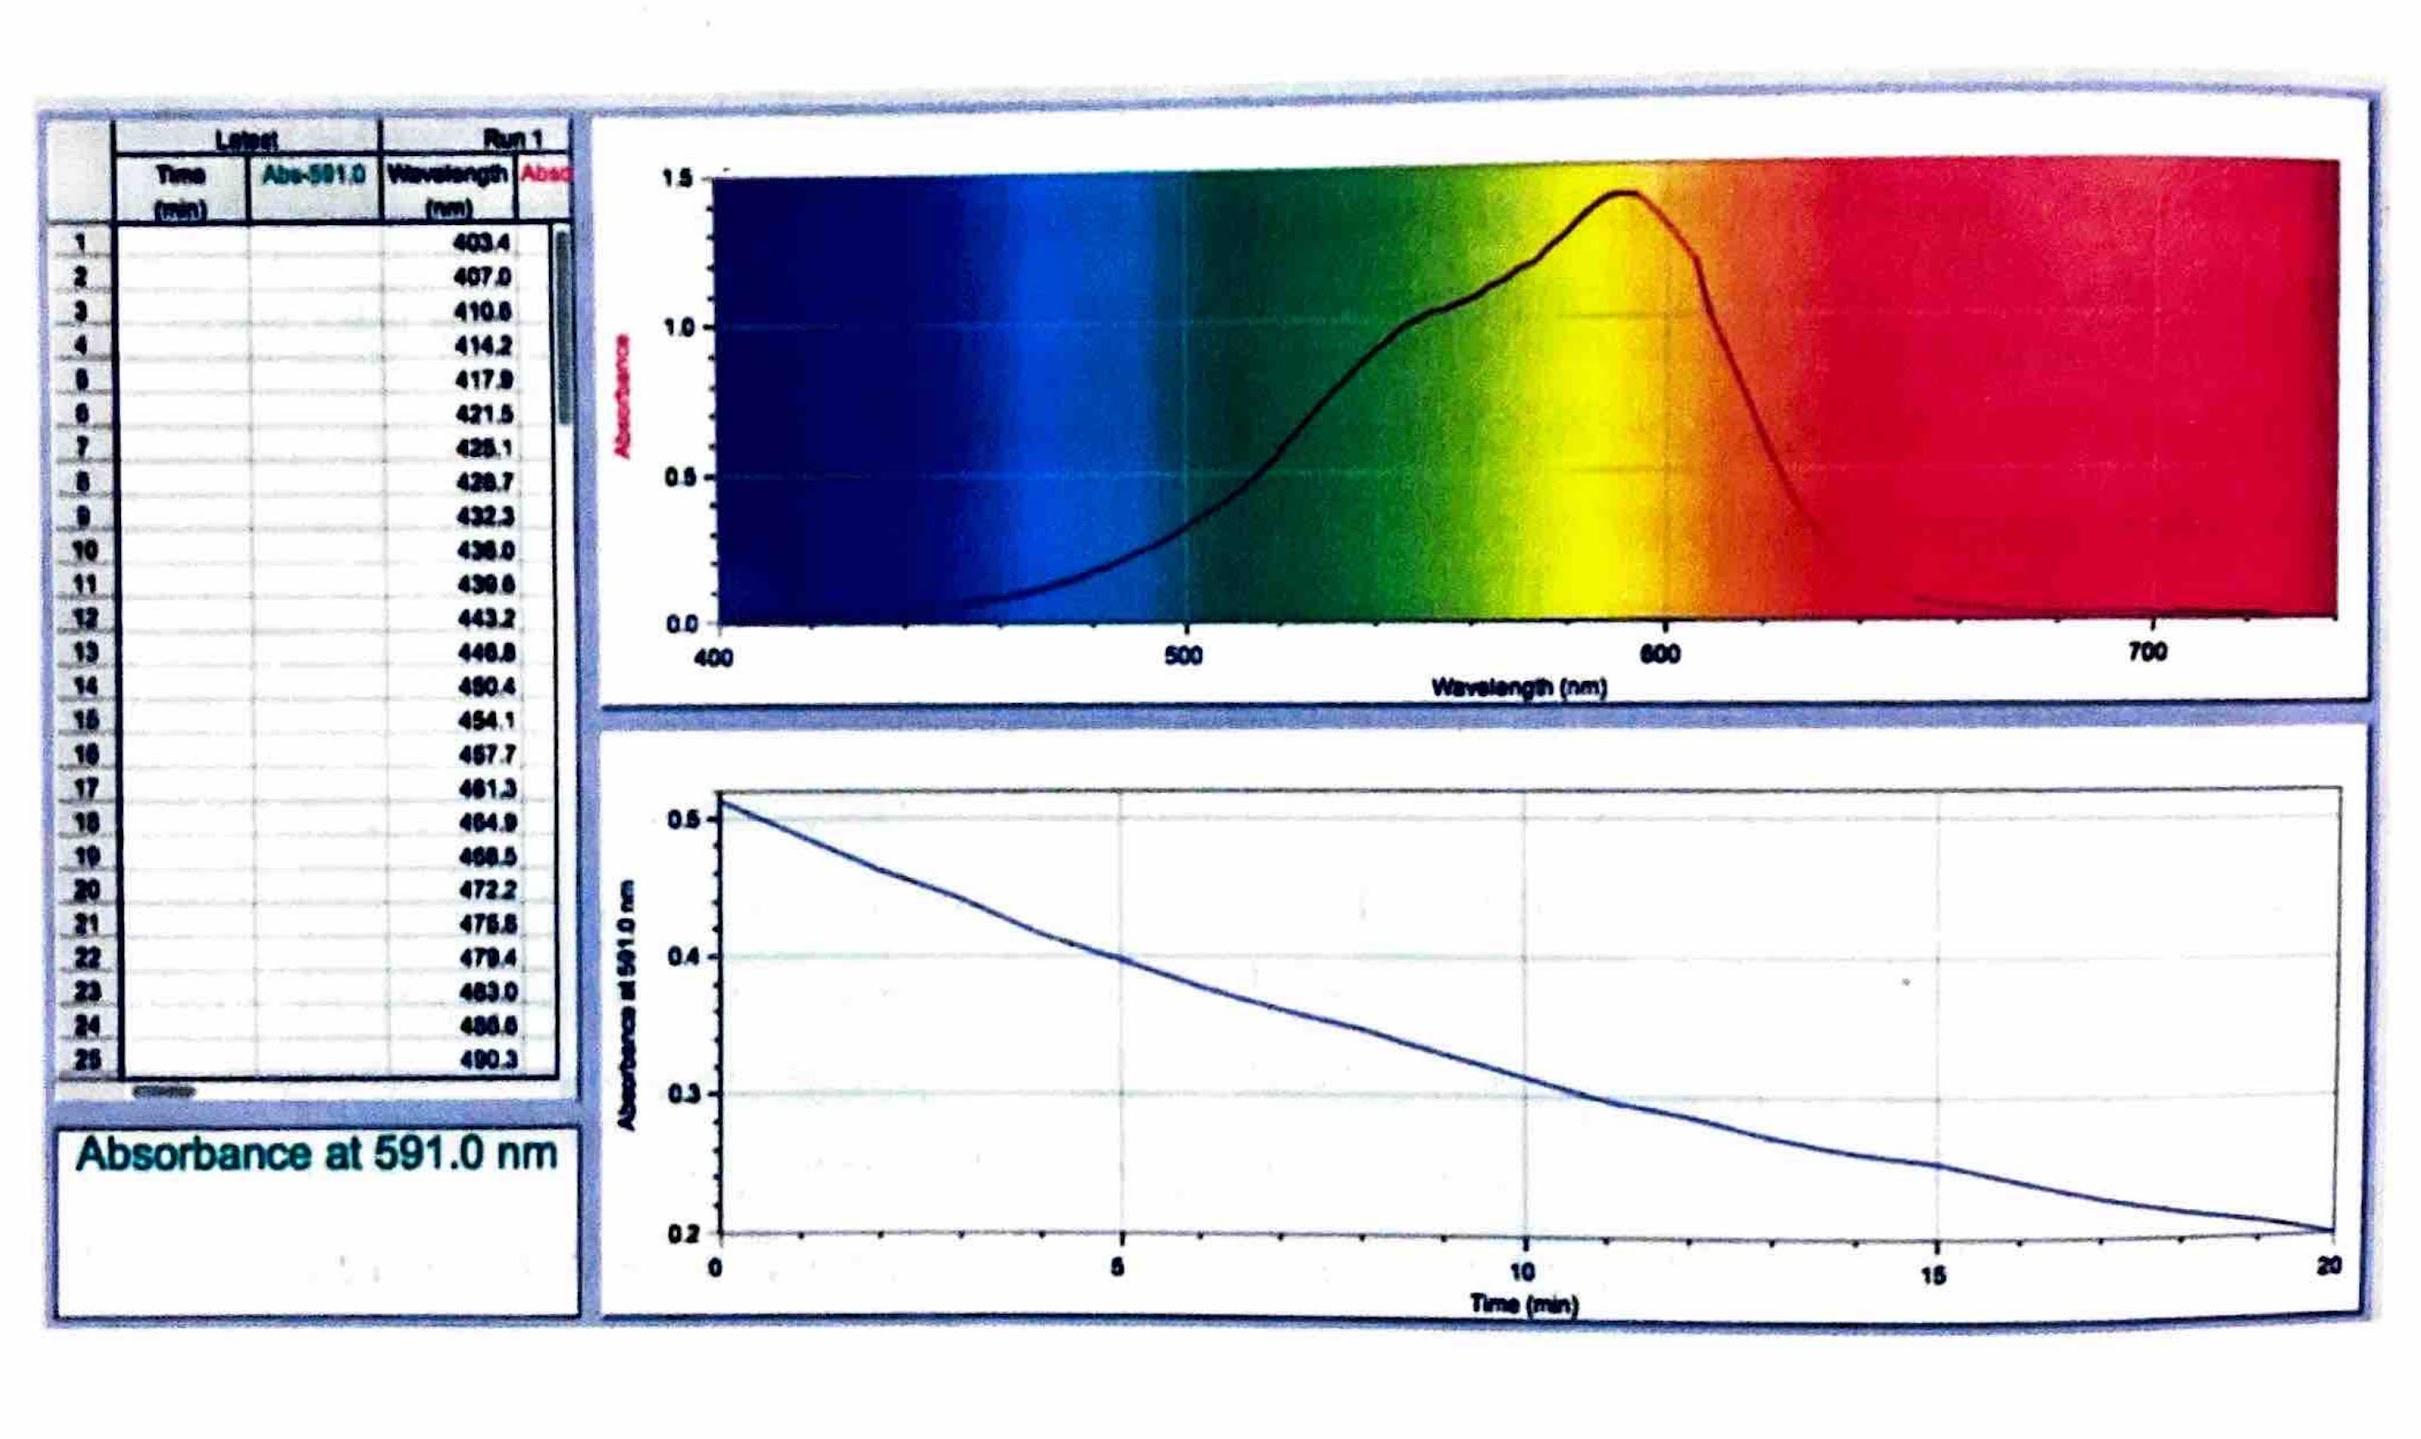
Example: Crystal Violet and Sodium Hydroxide Reaction

An excellent example of measuring reaction rate via light transmission is the reaction between crystal violet (CV+) and sodium hydroxide (OH
Diagram
-): CV+ + OH- → CVOH In this reaction, the crystal violet reactant is intensely colored, while the product, CVOH, is colorless. Therefore, the reaction rate can be conveniently measured by monitoring the decrease in absorbance (or increase in transmittance) of the solution over time as the colored crystal violet is consumed.

Measuring Rate by Titration

Titration is a method used to determine the concentration of a reactant or product by reacting it with a solution of known concentration (a standard). To monitor reaction rates, samples are periodically removed from the reaction mixture at specific time intervals. These samples are then analyzed by titration. To prevent the reaction from continuing in the sample after it has been drawn, a process called "quenching" is often employed, where a substance is added to effectively stop the reaction. For instance, the concentration of iodine in a reaction can be determined by titrating it with sodium thiosulfate. At regular time intervals, samples are taken and quenched with sodium carbonate before titration.
Diagram

Measuring Rate by Change in Conductivity

The total electrical conductivity of a solution is dependent on the total concentration of ions present and their respective charges. Therefore, changes in conductivity can be used to monitor reaction rates if there is a net change in the number or type of ions as reactants are converted to products. A conductivity meter can be used to continuously record these changes. To relate conductivity measurements to actual concentrations, calibration is often performed. This involves measuring the conductivities of solutions with known concentrations and then graphing this data to create a calibration curve, which can then be used to determine the concentrations of unknown solutions from their measured conductivities. For example, a reaction that consumes ions or produces neutral molecules from ions would result in a decrease in conductivity.
Diagram

Non-Continuous Method: Clock Reactions

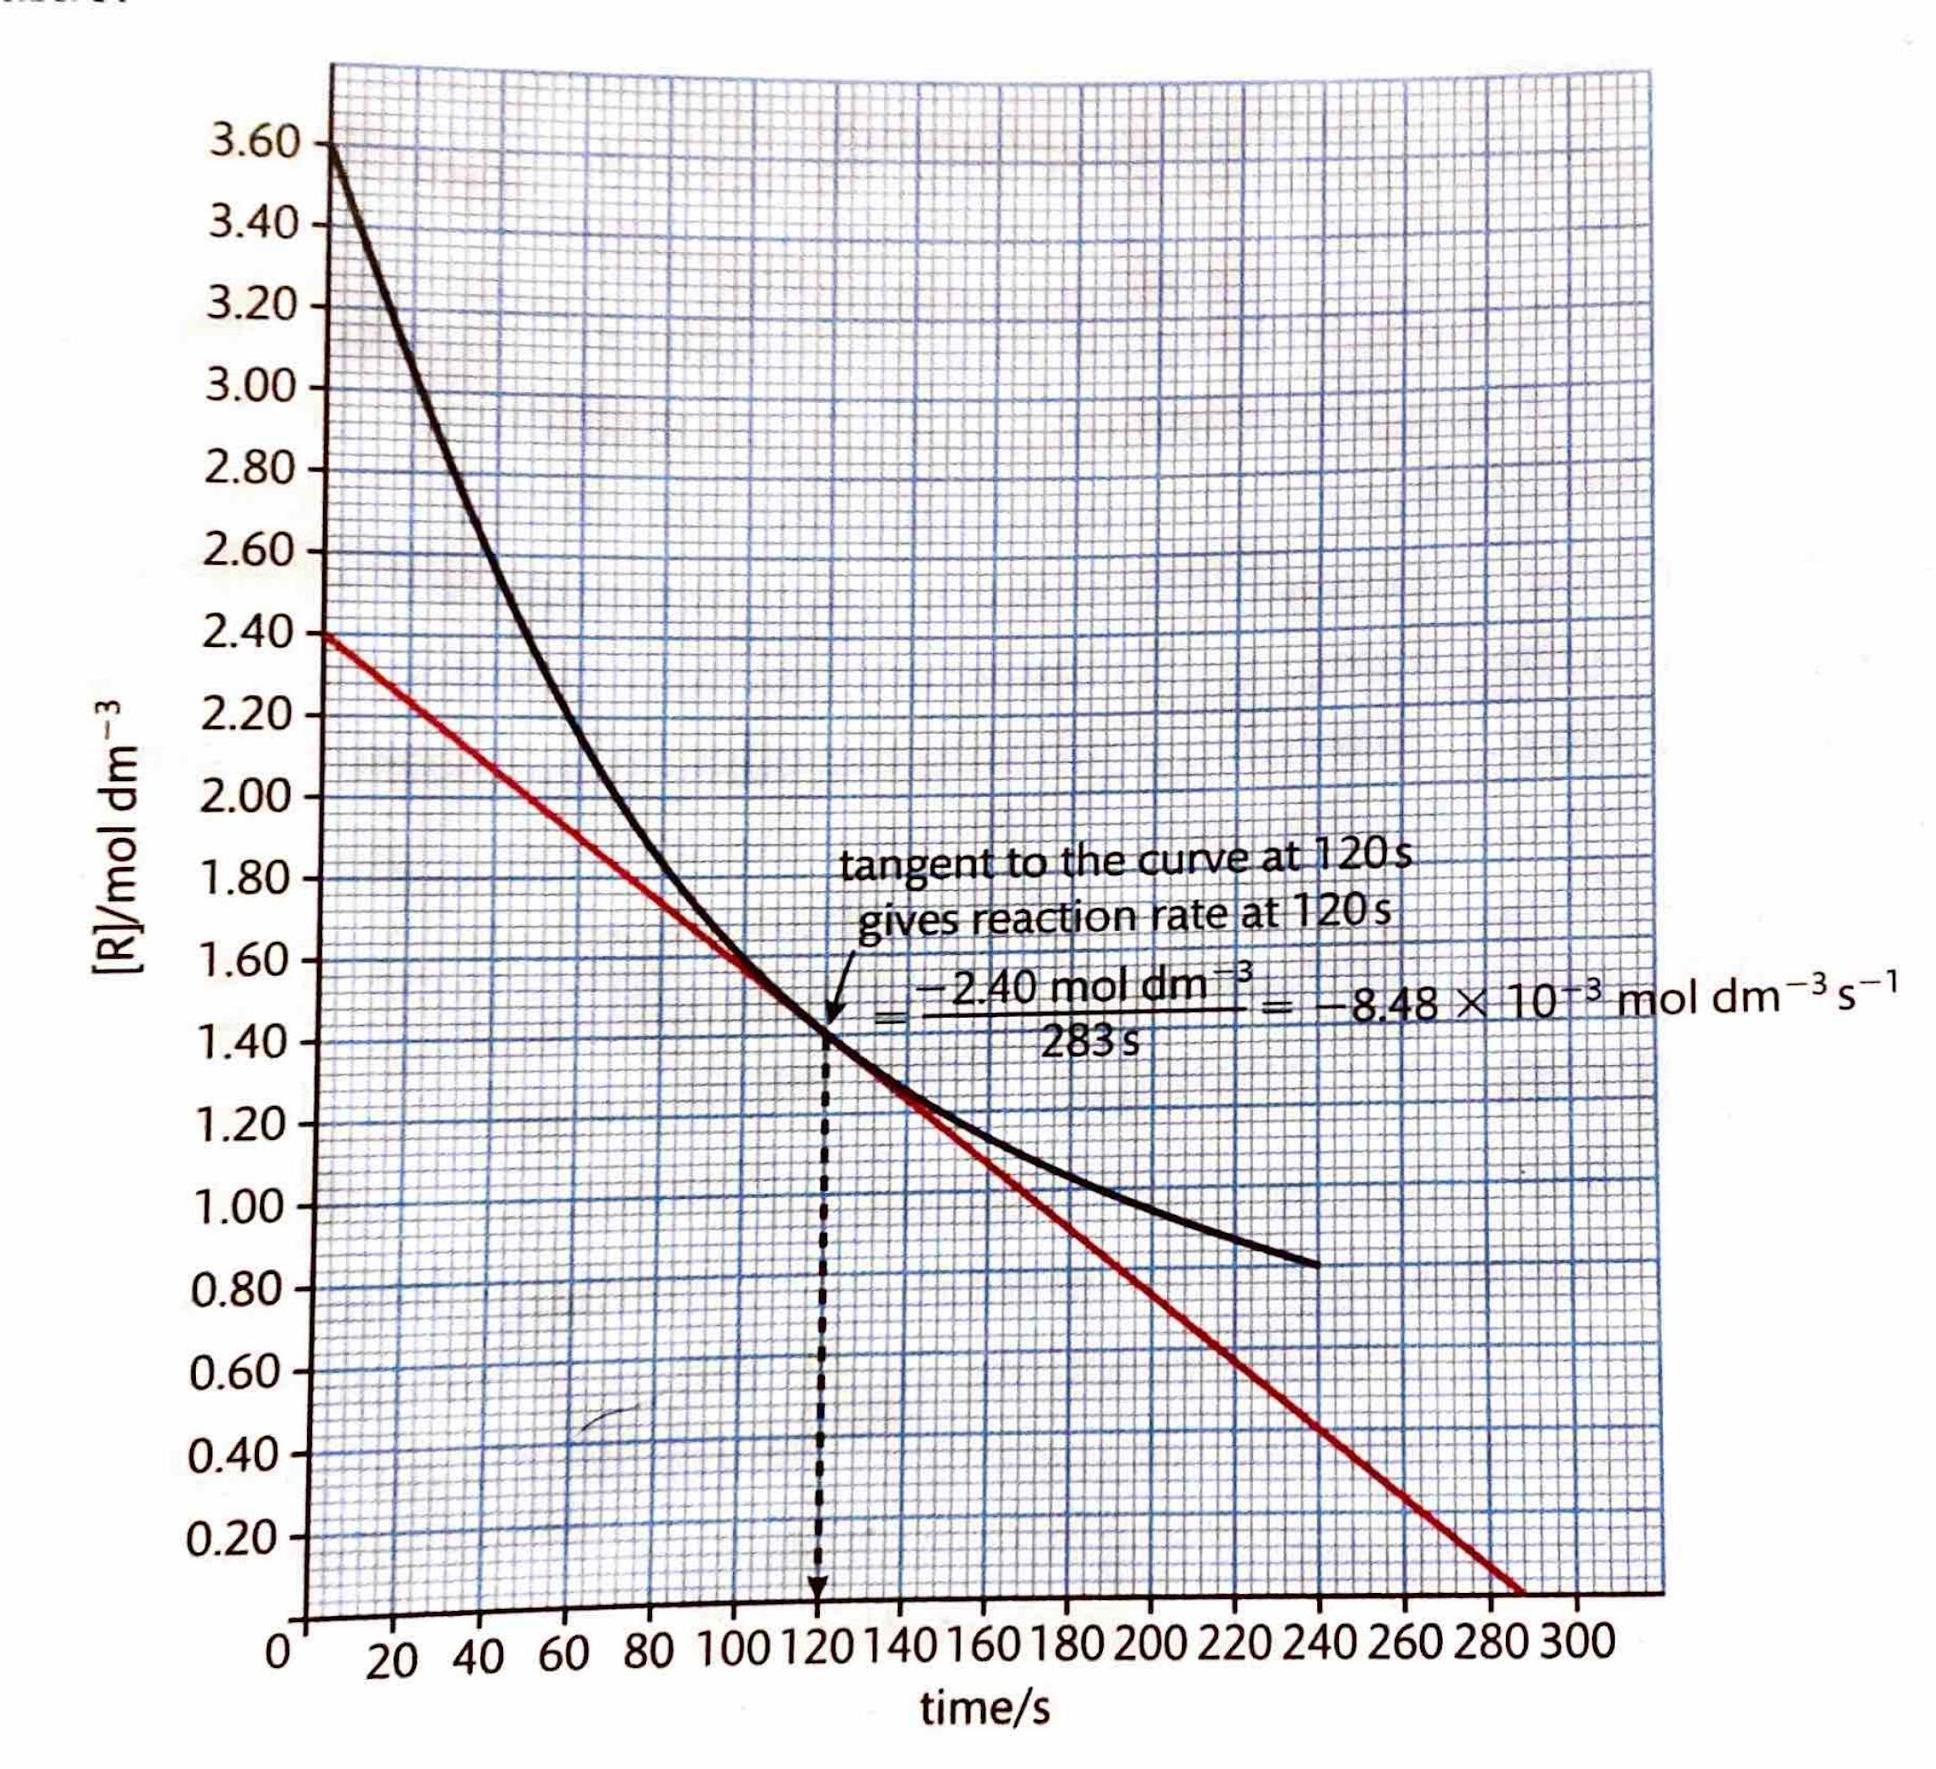
Clock reactions are a non-continuous method for measuring reaction rates. They involve determining the time it takes for a reaction to reach a specific, observable "end point." By comparing the time taken to reach this end point under different experimental conditions, insights into how reaction rates change can be gained. However, it is important to note that this method only provides an average rate of reaction over the measured time interval, rather than instantaneous rates.

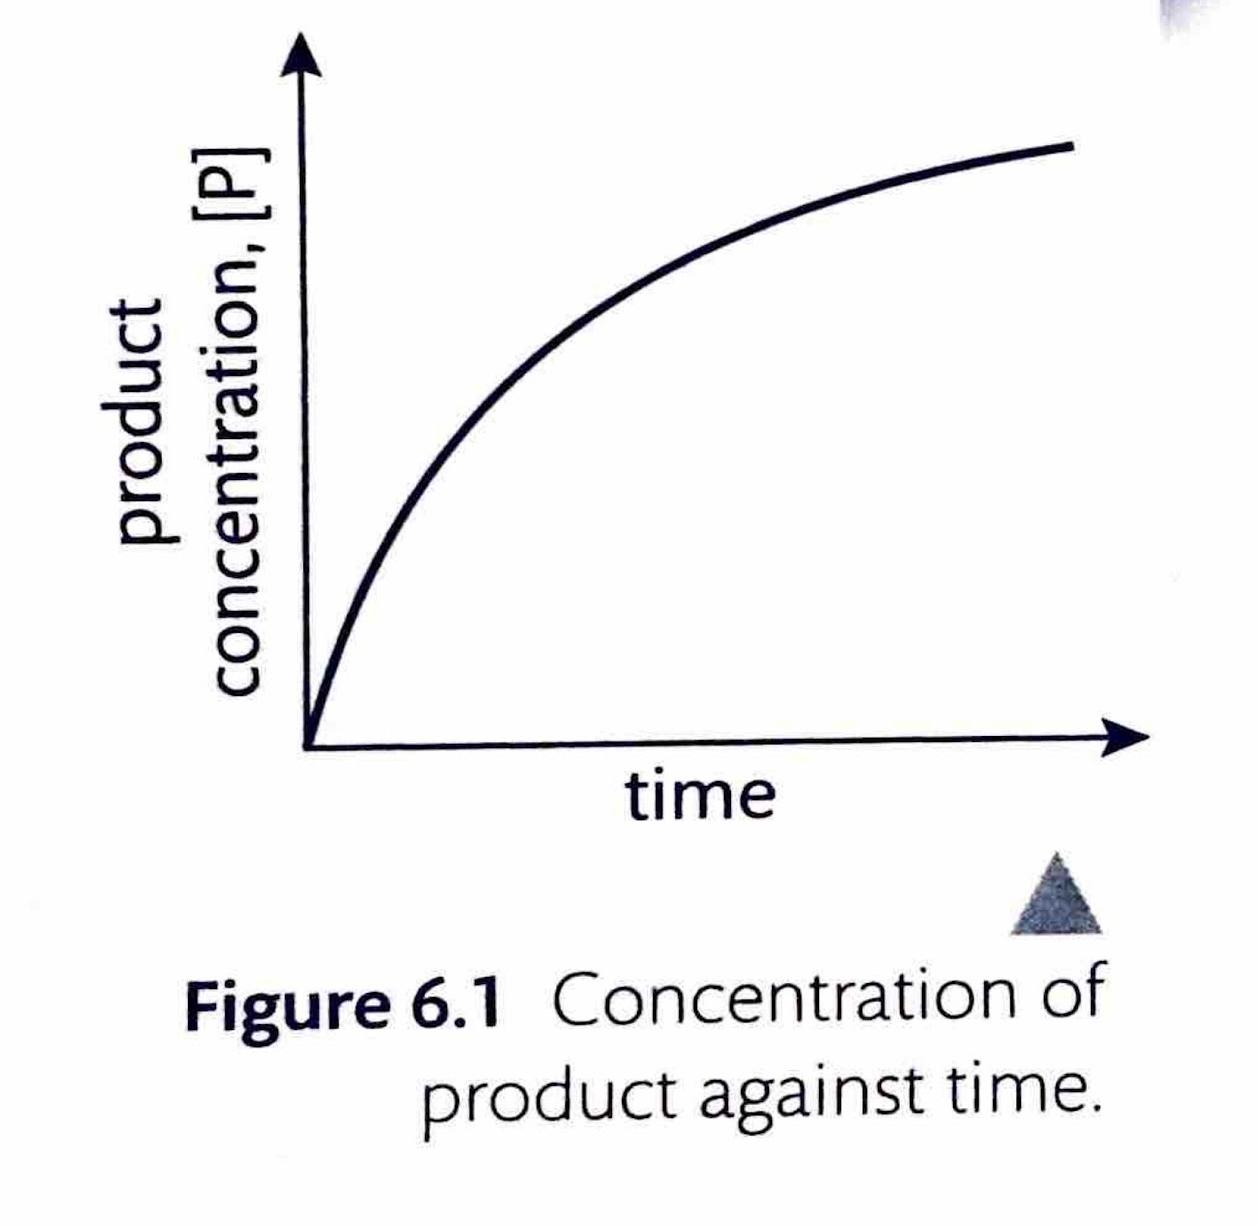
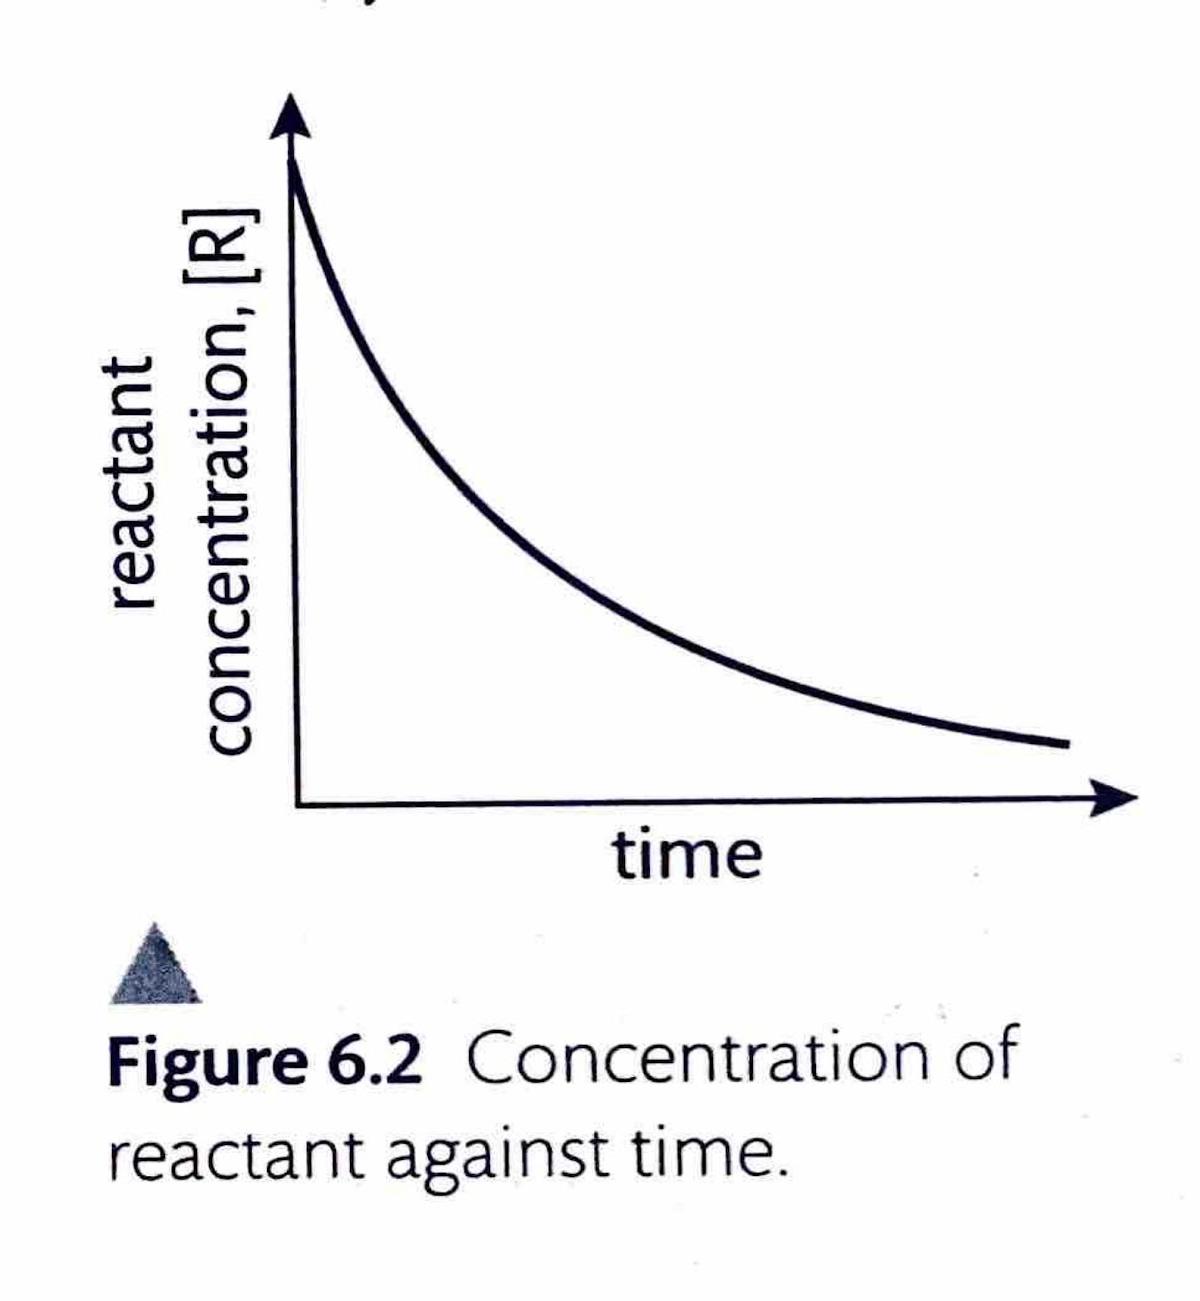
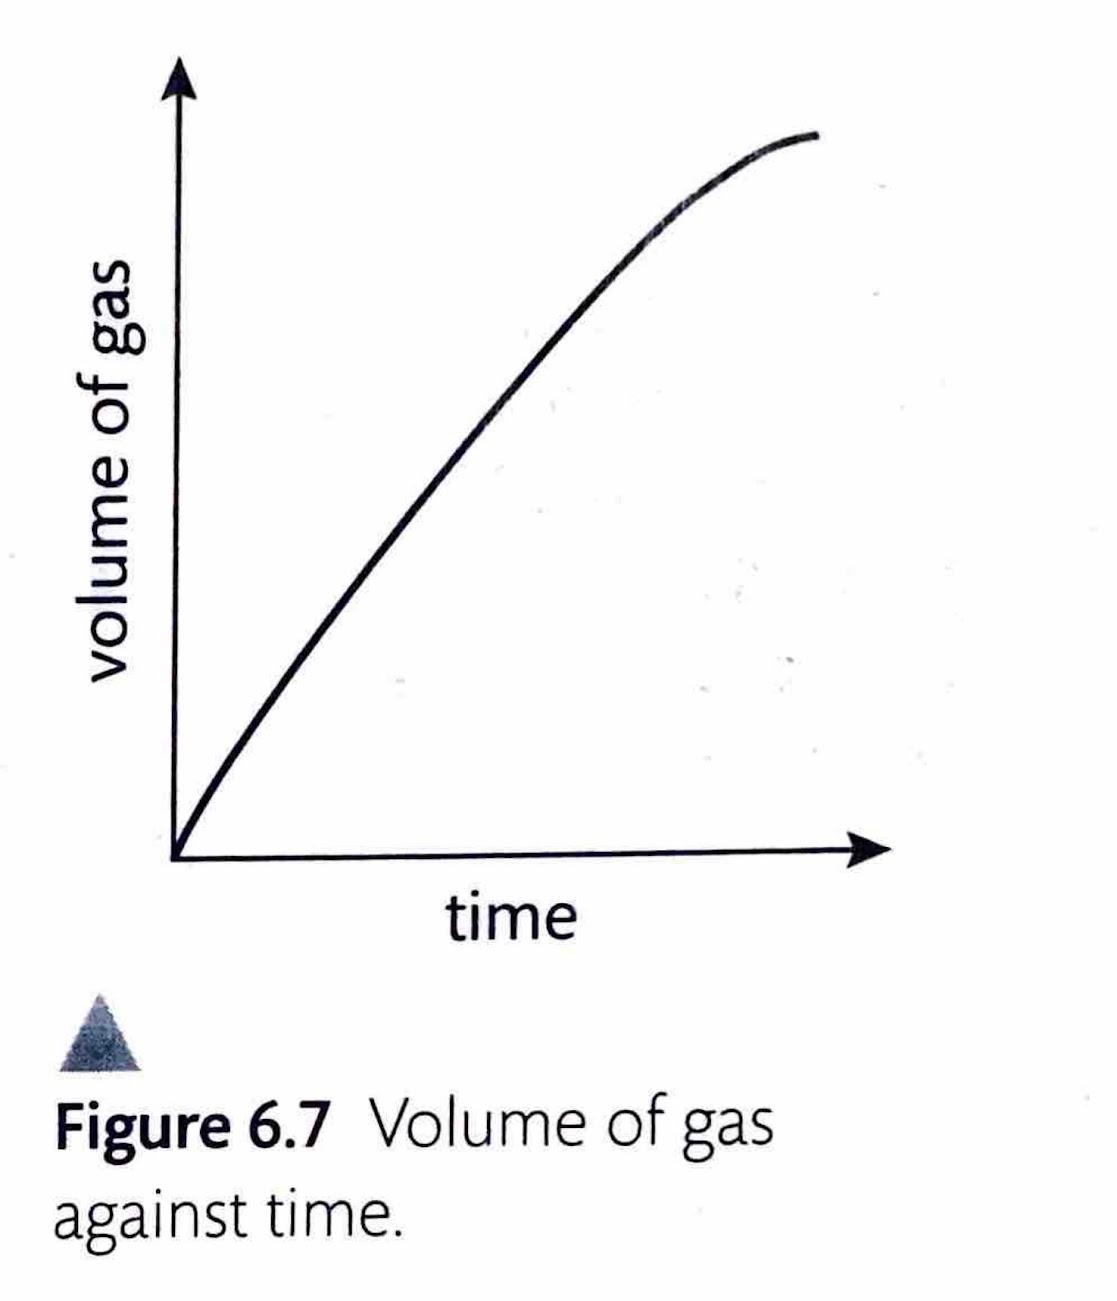
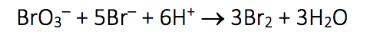
Calculating Instantaneous Rates

The instantaneous rate of a reaction at any given moment can be determined from a concentration-time graph. The steepness, or gradient, of the curve at a particular point represents the change in concentration per unit time, which is the reaction rate. Since the gradient of a curve is not constant, the rate can only be specified for a particular time point or a very short time frame. This instantaneous rate is measured by drawing a tangent to the curve at the desired time point. To ensure greater accuracy, the tangent should be extended as long as possible. By convention, even though the concentration of reactants ([R]) decreases over time, reaction rates are always expressed as positive values.
Diagram
4
Calculating Average & Instantaneous Rates

Understanding Average Reaction Rates

The average rate of a chemical reaction quantifies the change in concentration of a reactant or product over a specific time interval. It is mathematically expressed as the change in the concentration of a product (Δ[P]) divided by the change in time (Δt), or as the negative change in the concentration of a reactant (-Δ[R]) divided by the change in time (Δt). The negative sign for reactants ensures that the rate is always a positive value, as reactant concentrations decrease over time. This average rate can be estimated graphically by determining the slope of the secant line connecting two points on a concentration-time curve, or it can be calculated more precisely if discrete concentration and time data are provided in a table.
Diagram

Determining Instantaneous and Average Rates from a Graph

Consider a reaction where the concentration of a substance B changes over time, as depicted in a concentration-time graph. To find the average rate of disappearance of B between two specific time points, for instance, between 120 s and 380 s, one would calculate the change in concentration of B during that interval and divide it by the duration of the interval. Conversely, the instantaneous rate of disappearance of B at a particular moment, such as at 245 s, is determined by drawing a tangent line to the curve at that specific time point and calculating the slope of this tangent. The slope of the tangent represents the rate of change of concentration at that exact instant.
Diagram

Calculating Rates from Experimental Data

When experimental data for concentration versus time is collected, it can be plotted to visualize the reaction's progress and determine various reaction rates. For example, if we have data for the concentration of a reactant at different time points, we can plot these points and draw a smooth curve. From this curve, we can then determine the instantaneous rate at a specific time, such as after 60 s or after 120 s, by finding the slope of the tangent to the curve at those points. Similarly, the average rate between two time points, like between 60 s and 120 s, can be calculated by finding the slope of the secant line connecting the two points on the curve corresponding to those times.
Diagram

The Dynamic Nature of Reaction Rates

It is a fundamental characteristic of most chemical reactions that their rates change over time. Specifically, average reaction rates tend to decrease as the reaction progresses. This phenomenon is primarily due to the consumption of reactants. As reactants are used up, their concentrations decrease, leading to fewer effective collisions between reactant particles per unit of time. Consequently, the rate at which products are formed slows down. The units for concentration are typically mol dm
Diagram
-3, and therefore, reaction rates are commonly expressed in units of mol dm-3 s-1, representing the change in concentration per unit of time.
Diagram
Diagram