IB Chemistry Study Summary

Chemical Bonding & Structure

1
Chemical Bonds Overview

Introduction to Chemical Bonds

Chemical bonds represent a stable association between two or more atoms, leading to the formation of molecules or compounds. The primary purpose of bond formation is to achieve a more stable electron configuration for the participating atoms, typically resembling that of a noble gas. There are three main types of chemical bonds: ionic, covalent, and metallic. It is important to note that atoms linked by chemical bonds exhibit properties distinct from their individual parent atoms. Chemical reactions fundamentally involve the breaking of existing bonds and the subsequent formation of new ones. Therefore, the ability to predict bond formation and comprehend the nature of these bonds is crucial for understanding and predicting chemical reactivity.

Formation and Characteristics of Ions

Ions are formed when atoms either gain or lose valence electrons, which are the electrons located in the outermost shell. The specific charge on an ion is directly determined by the number of valence electrons gained or lost. Atoms undergo this process to achieve the stable electron configuration of a noble gas. Typically, elements in Groups 1, 2, and 13 tend to lose their valence electrons, forming positively charged ions known as cations. Conversely, elements in Groups 15, 16, and 17 gain valence electrons, resulting in the formation of negatively charged ions called anions. Elements in Group 14 generally do not readily form ions due to the energy required to either gain or lose four electrons. When writing the symbol for an ion, the charge is indicated as a superscript, with the number preceding the sign (e.g., N3-). For charges of 1+ or 1-, the number '1' is typically omitted (e.g., Na+, F-).

Electron Transfer in Ion Formation

The following table illustrates how various elements achieve stable electron configurations by gaining or losing valence electrons, leading to the formation of ions.
Group Number Example Number of Valence Electrons Electrons lost or gained Number of electrons transferred Charge on ion formed Type of element
1 sodium 1 lost 1 1+ metal
2 calcium 2 lost 2 2+ metal
13 aluminum 3 lost 3 3+ metal
14 carbon 4 - - - non-metal
15 phosphorus 5 gained 3 3- non-metal
16 oxygen 6 gained 2 2- non-metal
17 bromine 7 gained 1 1- non-metal
2
Ionic Bonding

Variable Oxidation States of Transition Elements

Transition elements are unique in their ability to form various ions because their electron configurations allow them to lose electrons from both their s and d orbitals. This characteristic leads to the formation of different ions, each possessing distinct properties, such as varying colors in solution. When naming compounds involving transition elements, their oxidation number is indicated by Roman numerals in brackets immediately following the element's name; for instance, copper(I) oxide refers to Cu2O. Common ions formed by transition elements include Fe2+ and Fe3+ for iron, Pb2+ for lead, Sn2+ and Sn4+ for tin, Ag+ for silver, and Cu+ and Cu2+ for copper.
Diagram

Formation and Characteristics of Ionic Compounds

Ionic compounds typically form between metals and nonmetals through a process called ionization, where electrons are transferred from one atom to another. The resulting oppositely charged ions are then held together by strong electrostatic forces, which constitute the ionic bond. A fundamental characteristic of all ionic compounds is that they are electrically neutral, meaning the total positive charge from the cations perfectly balances the total negative charge from the anions. When writing the chemical formulas for ionic compounds, it is essential to balance these charges to reflect their electrical neutrality. For example, magnesium oxide (MgO) forms from Mg2+ and O2-, while magnesium fluoride (MgF2) forms from Mg2+ and F-, requiring two fluoride ions to balance the charge of one magnesium ion.
Diagram

Conventions for Naming and Writing Ionic Compound Formulas

When naming ionic compounds, a common convention is to change the ending of the non-metal element's name to '-ide' when it forms an ion, as seen in examples like sodium chloride and potassium oxide. The positive ion (cation) is always written first, followed by the negative ion (anion). Furthermore, the chemical formula of an ionic compound represents the simplest whole-number ratio of the ions it contains; for instance, the formula for magnesium oxide is written as MgO, not Mg2O2, even though the latter also represents a neutral compound.

The Criss-Cross Method for Deriving Ionic Formulas

A practical method for determining the chemical formula of an ionic compound is often referred to as the "criss-cross" method. This technique involves taking the numerical value of the charge of one ion and using it as the subscript for the other ion, effectively balancing the charges.
Diagram

Understanding Polyatomic Ions

Polyatomic ions are species composed of more than one atom that, as a whole, have either gained or lost electrons, resulting in an overall charge. Many polyatomic ions are prevalent in commonly occurring compounds. A useful naming convention is that polyatomic ions whose names end in '-ate' typically contain oxygen bonded to another element.
Polyatomic ion name Charge on ion Symbol Example of compound containing this ion
nitrate 1- NO3- lead nitrate
hydroxide 1- OH- barium hydroxide
hydrogen carbonate 1- HCO3- potassium hydrogen carbonate
carbonate 2- CO32- magnesium carbonate
sulfate 2- SO42- copper sulfate
phosphate 3- PO43- calcium phosphate
ammonium 1+ NH4+ ammonium chloride

Bonding within Polyatomic Ions and Ionic Compounds

It is important to note that polyatomic ions themselves contain covalent bonds between their constituent atoms, while the overall compound formed with other ions involves ionic bonds. This means that compounds containing polyatomic ions exhibit both covalent and ionic bonding.
Diagram
Diagram

Naming Compounds with Polyatomic Ions

When naming compounds that contain polyatomic ions, the entire polyatomic ion is treated as a single unit. This simplifies the naming process, as the name of the polyatomic ion is used directly, similar to how a monatomic ion's name would be used.
Diagram
3
Properties of Ionic Compounds

The Ionic Lattice Structure

In an ionic compound, ions are arranged in a predictable three-dimensional crystalline structure, known as an ionic lattice. This structure is characterized by each ion being surrounded by ions of opposite charge. The lattice always involves a fixed arrangement of ions based on a repeating unit. The coordination number expresses the number of ions that surround a given ion within this lattice; for example, in sodium chloride (NaCl), each Cl- ion is surrounded by six Na+ ions, giving it a coordination number of 6. An ionic lattice consists of a large number of ions and can grow indefinitely. Consequently, ionic compounds do not exist as discrete units with a fixed number of ions; instead, their chemical formulas represent the simplest ratio of ions present.

Diagram

Diagram

Lattice Enthalpy and its Influence

Lattice enthalpy is a quantitative measure of the strength of the electrostatic attraction between ions within an ionic lattice. This strength is greater for ions that are small and highly charged, as these characteristics lead to a higher charge density. A higher lattice enthalpy indicates stronger ionic bonds, which in turn influences many of the physical properties of the compound.

Diagram

High Melting and Boiling Points

Ionic compounds typically exhibit high melting and boiling points because the electrostatic forces of attraction between ions in the lattice are very strong, requiring a significant amount of energy to overcome them. This strong attraction means that ionic compounds are solids at room temperature. The melting and boiling points are even higher when the charge on the ions is greater, due to the increased electrostatic attraction. The high melting points of ionic compounds can be an important economic consideration in industrial processes, such as the extraction of metals from their ores. Furthermore, ionic compounds generally have low volatilities, which is their tendency to vaporize, and this often results in them having little to no odor.

Diagram

Solubility in Different Solvents

Solubility refers to the ease with which a solid (solute) disperses through a liquid (solvent) to form a solution. This property is determined by the extent to which the separated solute particles can form bonds or attractive forces with the solvent. Ionic compounds are generally soluble in polar solvents, such as water, but insoluble in non-polar solvents. When an ionic compound dissolves in water, the partial charges of the water molecules are attracted to the oppositely charged ions in the lattice. This attraction causes the ions to be dislodged from the lattice and become surrounded by water molecules, a process known as hydration. If the ions are surrounded by liquids other than water, they are said to be solvated. Non-polar solvents lack charge separation, meaning there is no significant attraction between the solvent molecules and the ions, which is why ionic compounds are insoluble in them. Solubility trends are fundamentally based on the principle that "like dissolves like," meaning substances with similar chemical natures tend to dissolve in each other.

Diagram

Electrical Conductivity

Ionic compounds can conduct electricity, but only under specific conditions. They are electrical insulators in their solid state because their ions are held in fixed positions within the lattice and cannot move freely. However, when ionic compounds are in the liquid (molten) state or dissolved in water (aqueous solution), their ions become mobile and are able to carry an electrical charge, thus allowing the substance to conduct electricity.

Diagram

Brittleness of Ionic Compounds

Ionic compounds are characterized by their brittleness, which is their tendency to shatter when a force is applied. This property arises from the rigid structure of the ionic lattice. When an external force causes a slight movement of ions within the lattice, it can bring ions of the same charge into close proximity. The resulting strong electrostatic repulsion between these like-charged ions causes the crystal to cleave or split apart.


Diagram

The Nature of Giant Ionic Compounds

All ionic compounds are described as "giant" because they consist of an endlessly repeating lattice of ions. This means that it is impossible to state a fixed number of ions within a single "molecule" of an ionic compound. Instead, their chemical formulas represent the simplest whole-number ratio of ions present in the extended lattice structure.

Diagram

Diagram

4
Ionic Character & Reactions

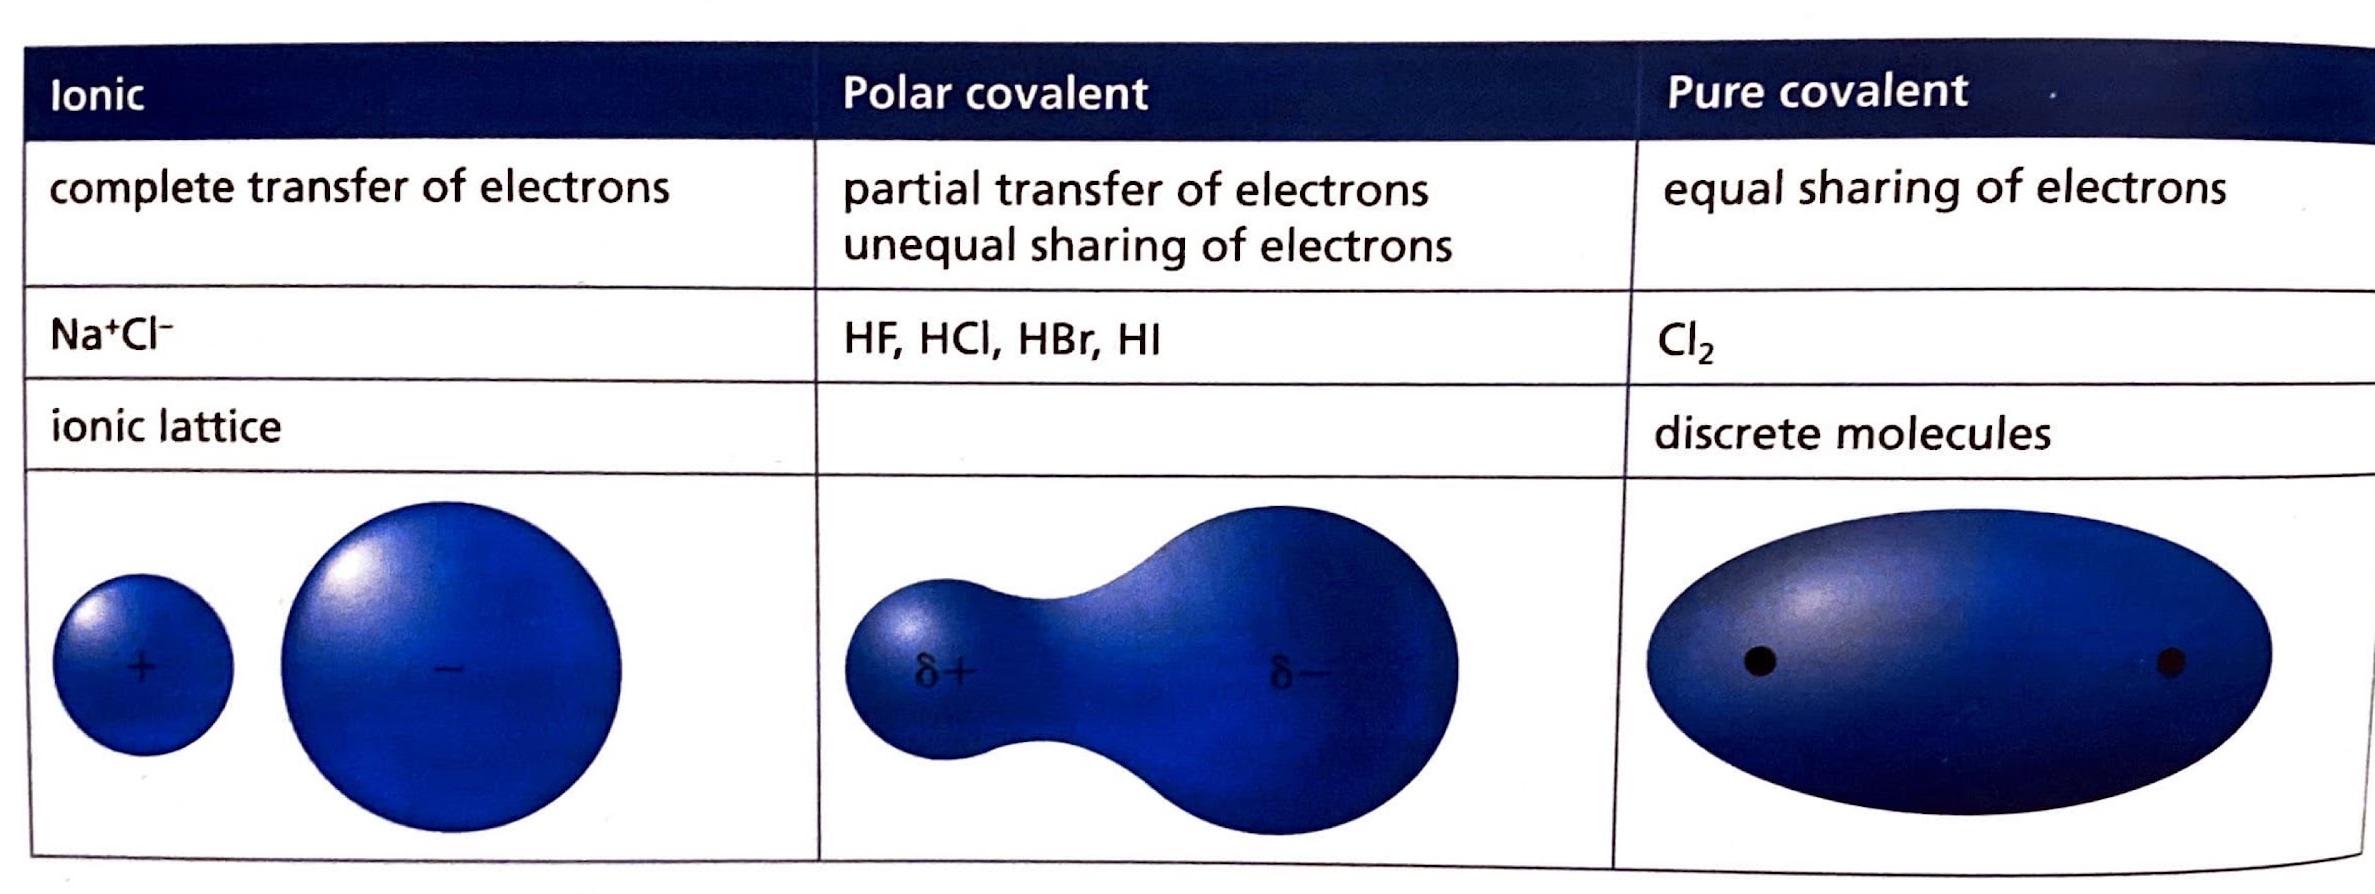
The Extent of Ionic Character

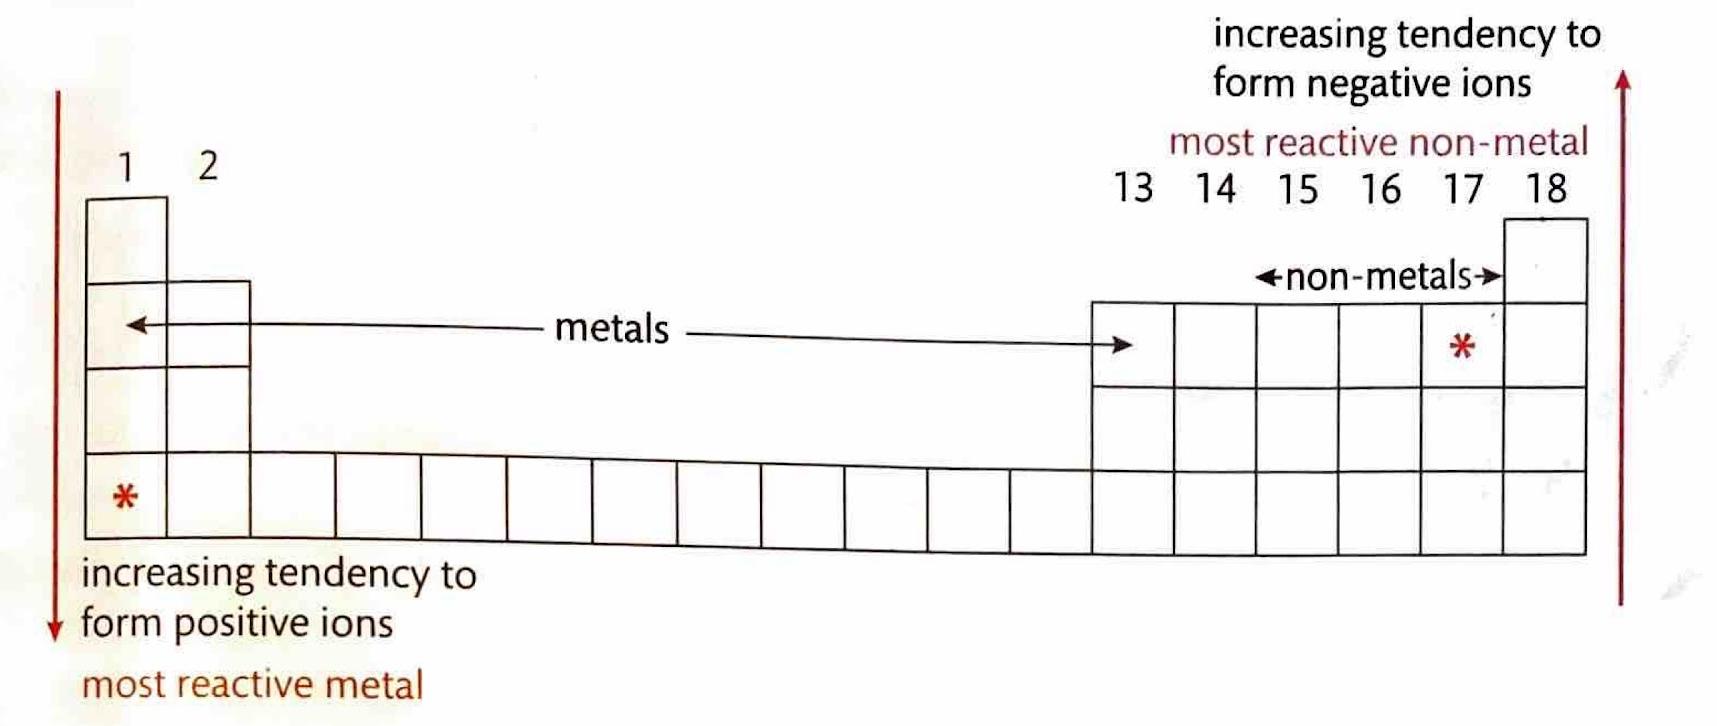
The ease with which elements form ionic compounds is largely determined by their positions on the periodic table. Elements located in the bottom-left corner, which are typically metals, readily react with nonmetals found in the top-right corner to form ionic bonds. This is due to the significant difference in their tendencies to gain or lose electrons.
Diagram
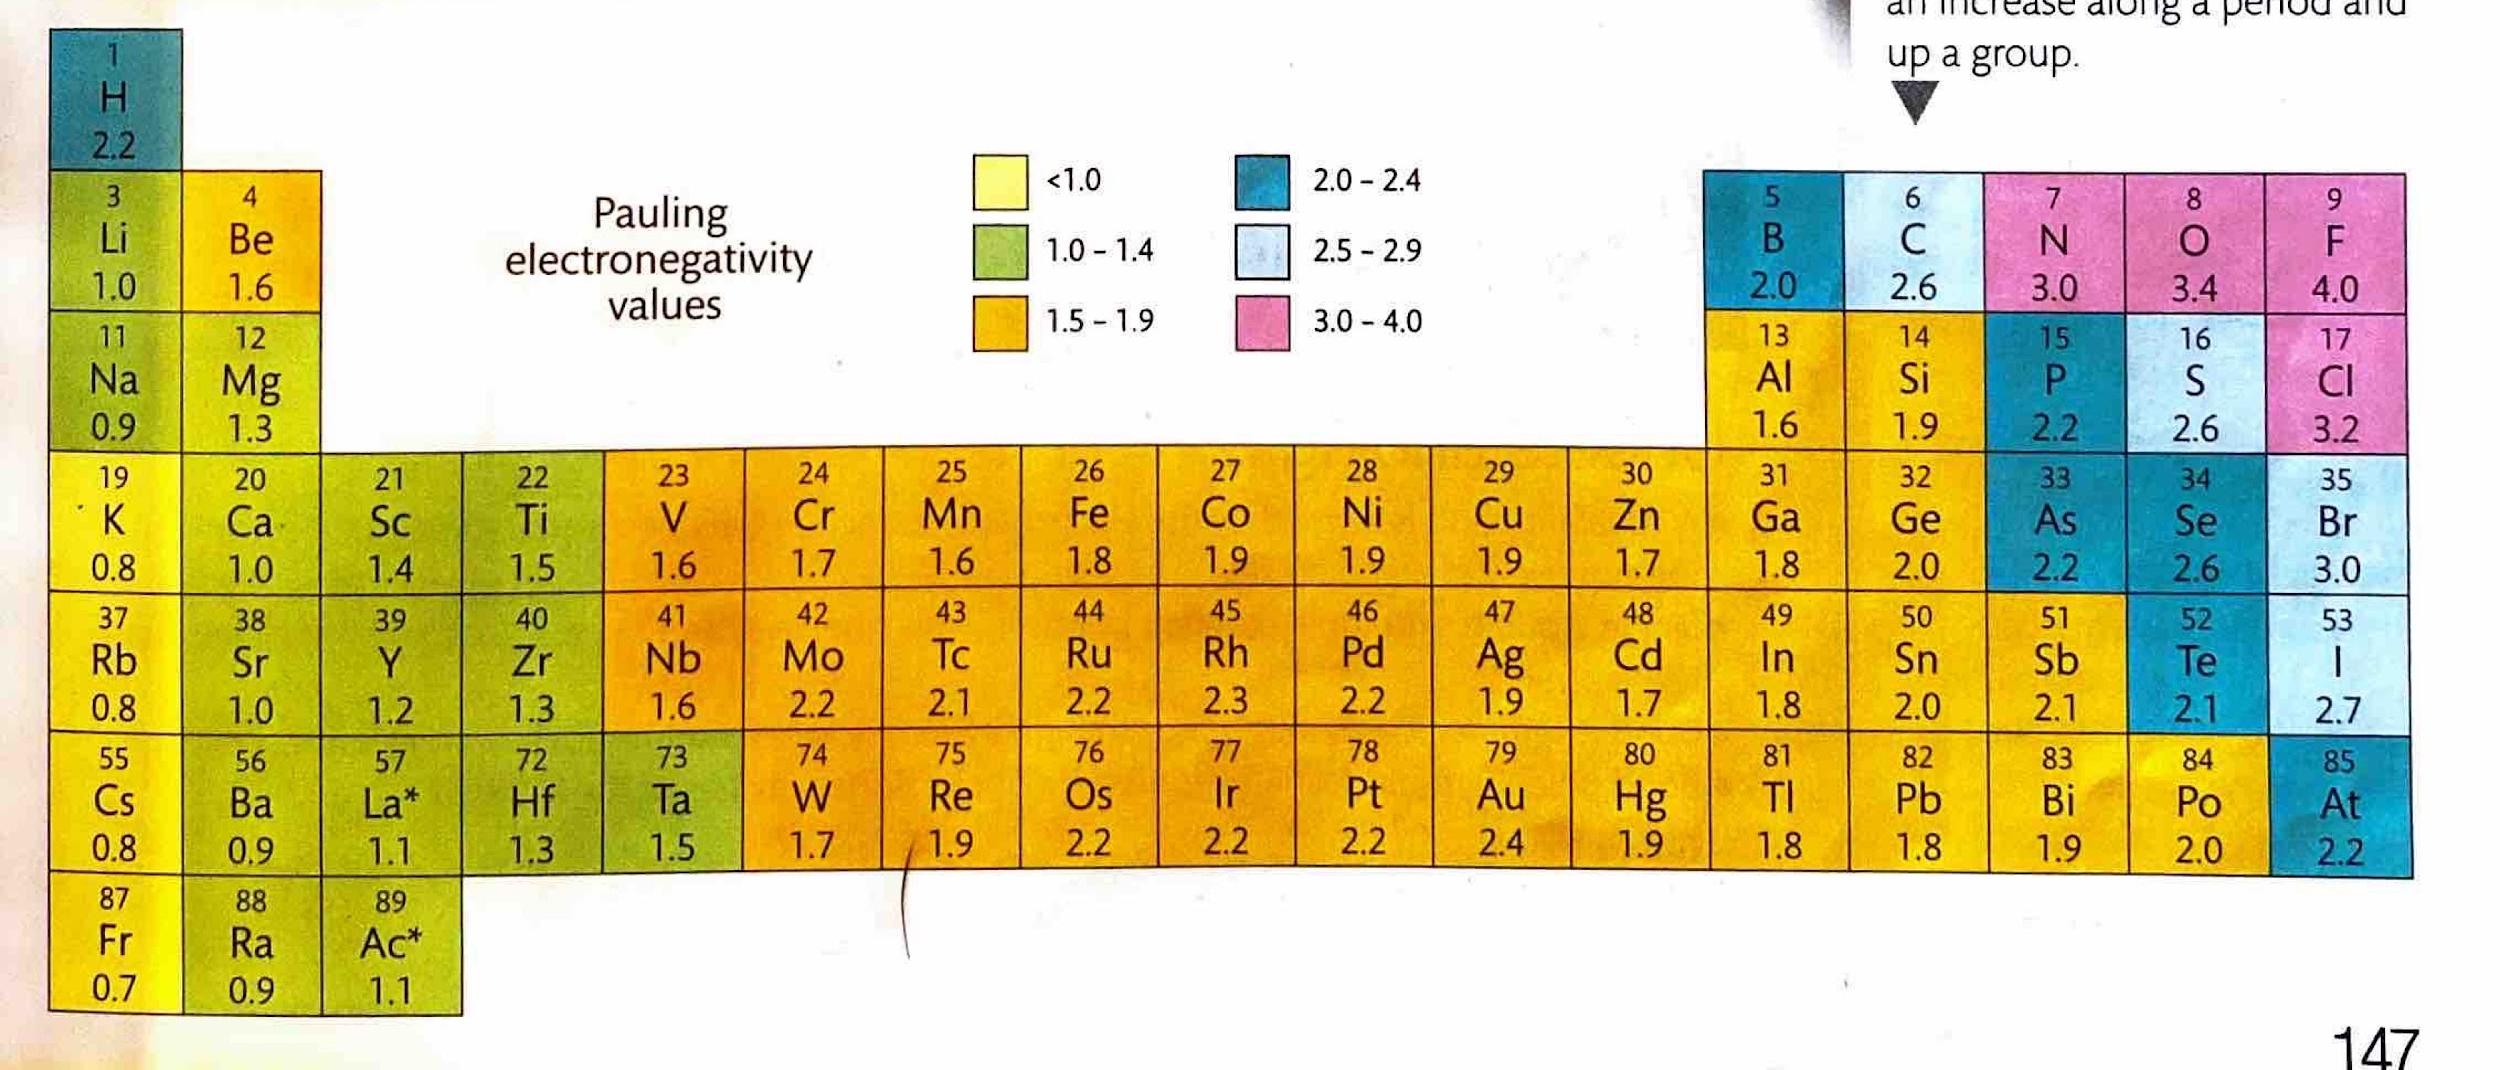
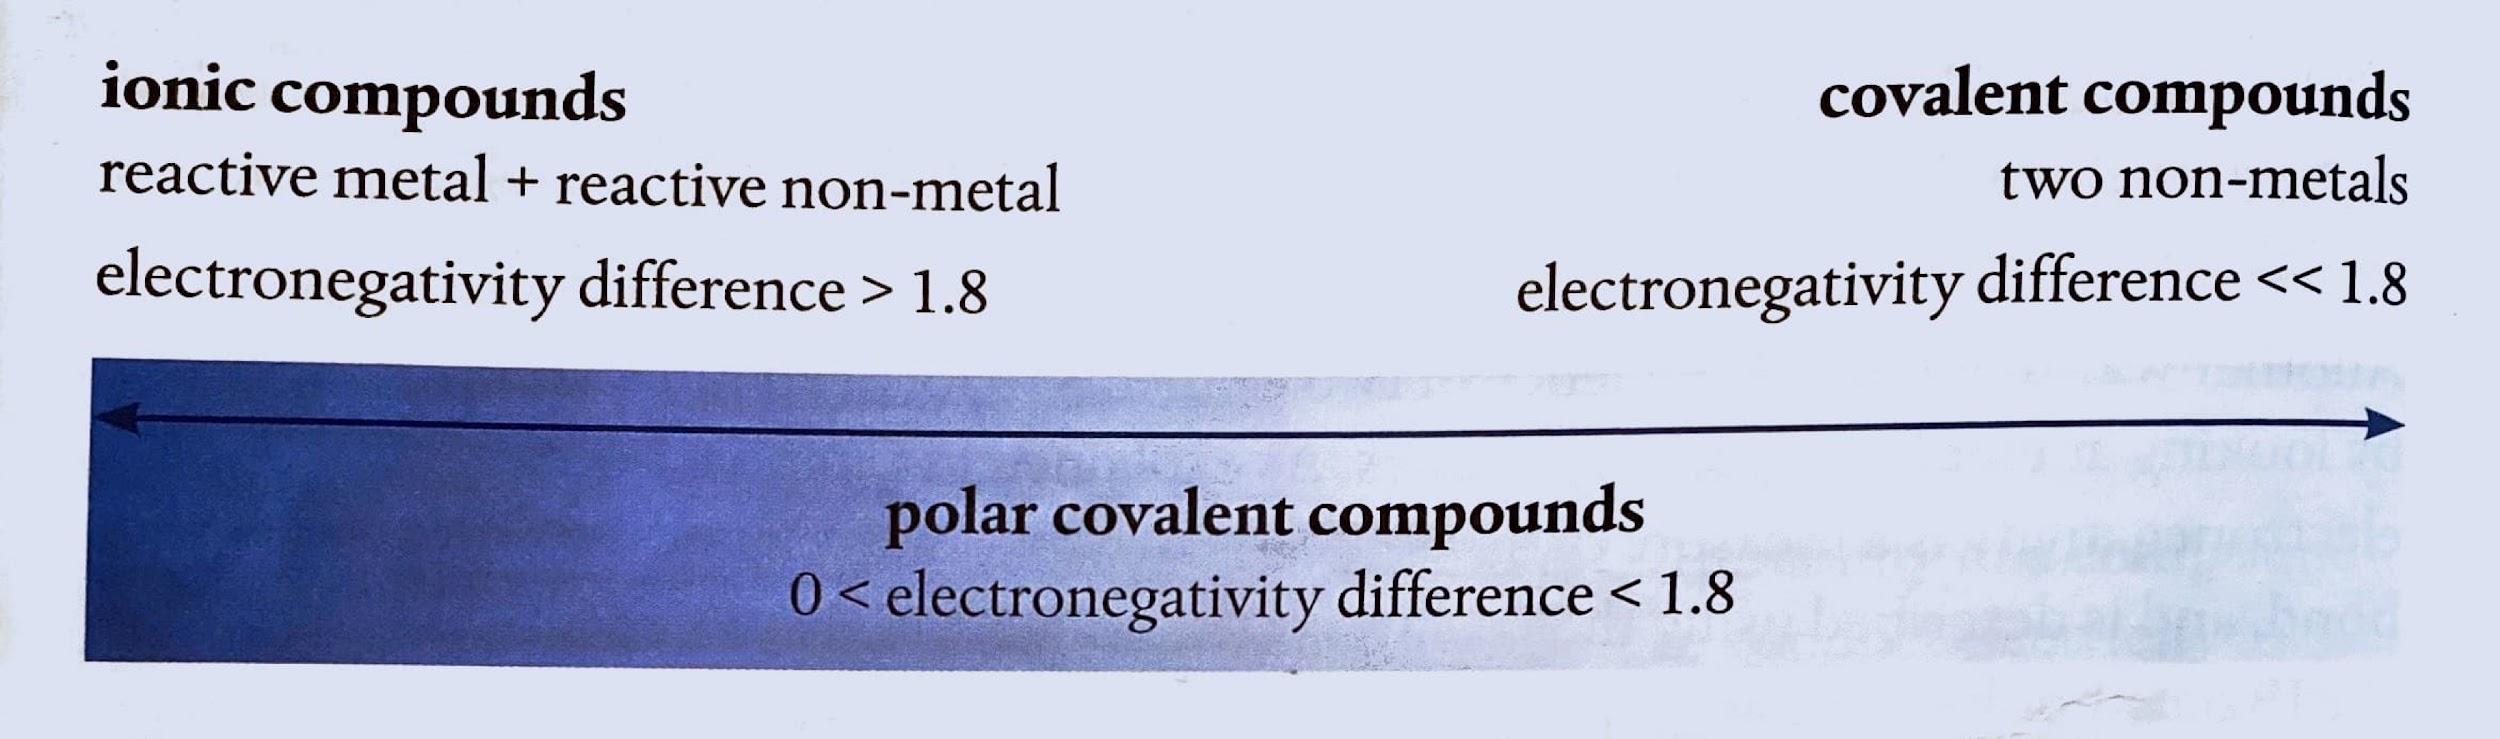
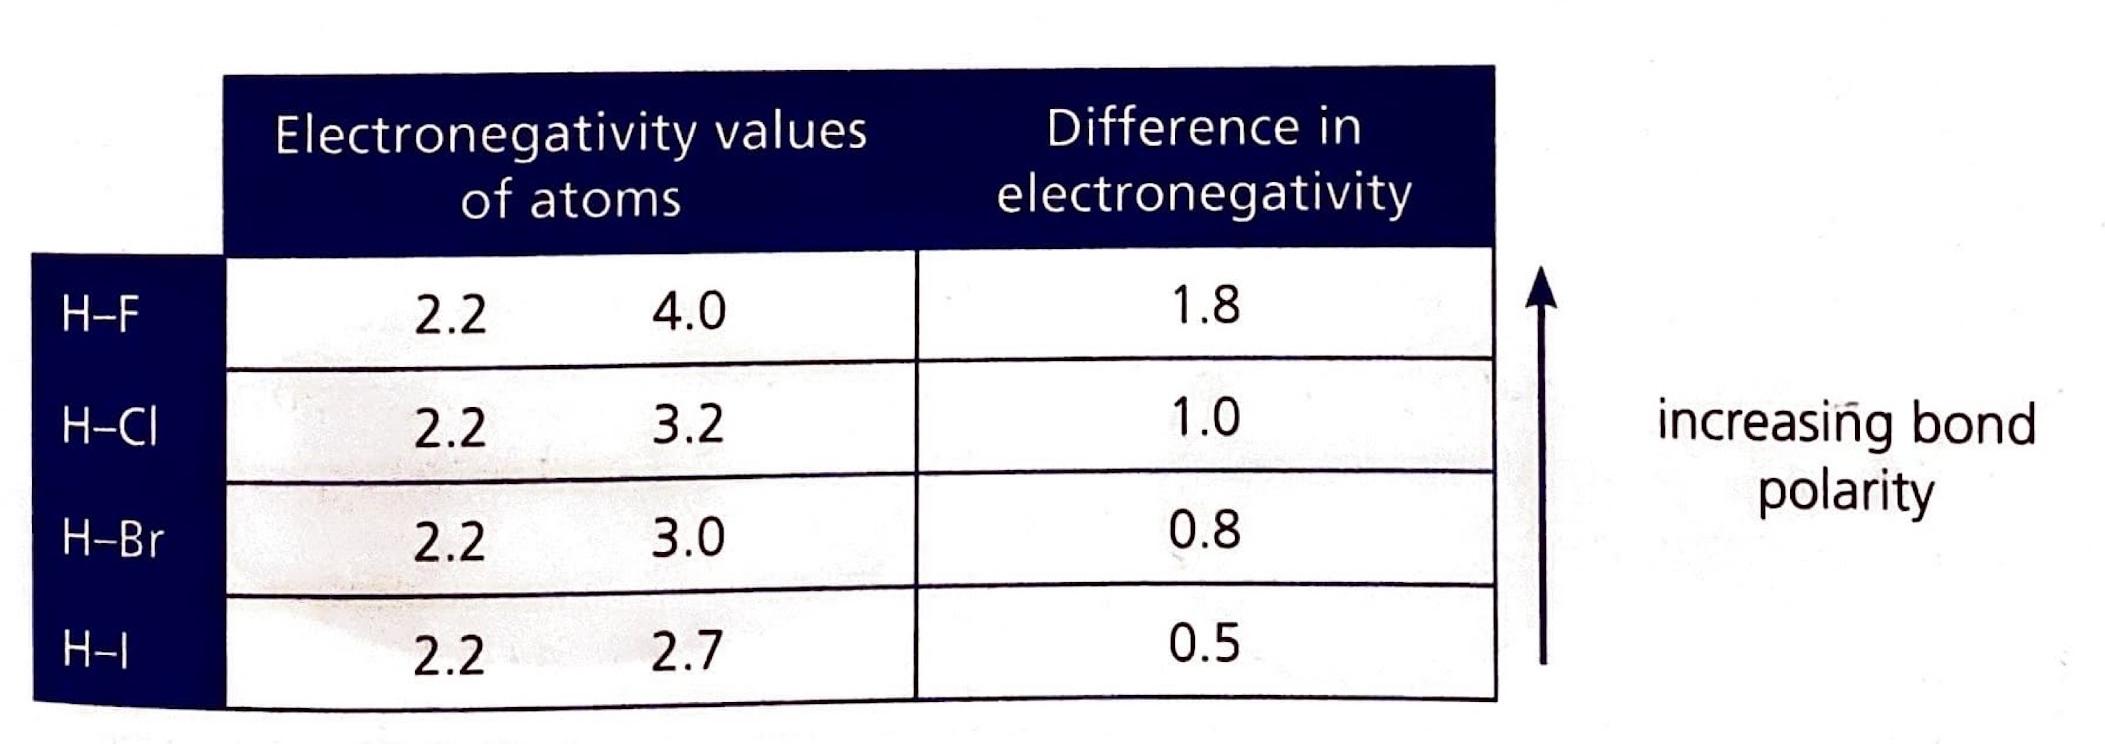
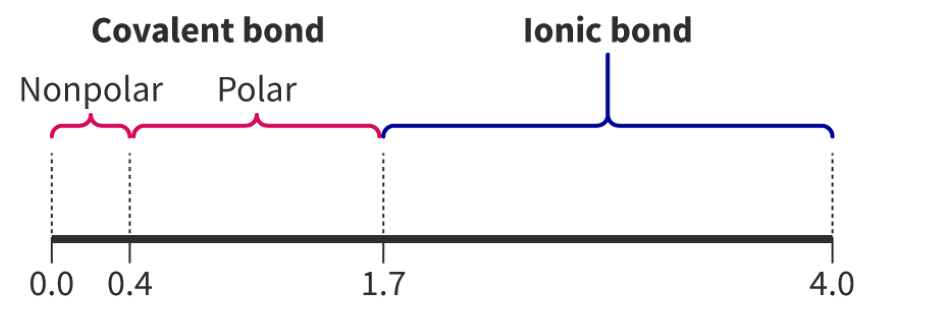
A crucial factor in determining the extent of ionic character in a bond is the difference in electronegativity (ΔEN) between the two bonded atoms. Bonds with a ΔEN greater than 1.8 are generally considered to be predominantly ionic. Electronegativity values, which quantify an atom's ability to attract electrons in a chemical bond, can be found in the Data Booklet.
Diagram

The Continuum of Chemical Bonding

It is important to understand that the distinction between ionic and covalent bonds is not absolute but rather represents a continuum. Many bonds exhibit characteristics of both ionic and covalent bonding, falling somewhere along this spectrum.
Diagram

Reactions Forming Ionic Compounds: Group 1 Elements

Group 1 alkali metals are highly reactive and readily form ionic compounds. For instance, when alkali metals react with water, they produce hydrogen gas and a metal hydroxide. The reactivity of these metals increases as one moves down the group, primarily because the effective nuclear charge experienced by the valence electrons decreases, making it easier to lose an electron. A typical example is the reaction of potassium with water: 2K(s) + 2H2O(l) → 2KOH(aq) + H2(g)
This can also be represented in its ionic form: 2K(s) + 2H2O(l) → 2K+(aq) + 2OH-(aq) + H2(g)
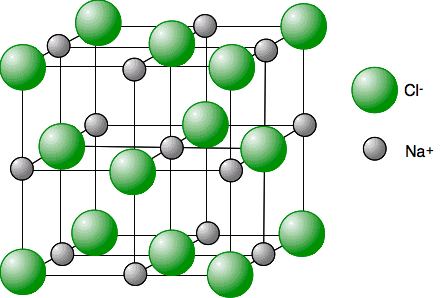
 Alkali metals also react vigorously with halogens to form ionic halides. The most energetic reactions occur between elements that are furthest apart on the periodic table, such as those at the bottom of Group 1 and the top of Group 17. For example, sodium reacts with chlorine to form sodium chloride:
2Na(s) + Cl2(g) → 2NaCl(s)

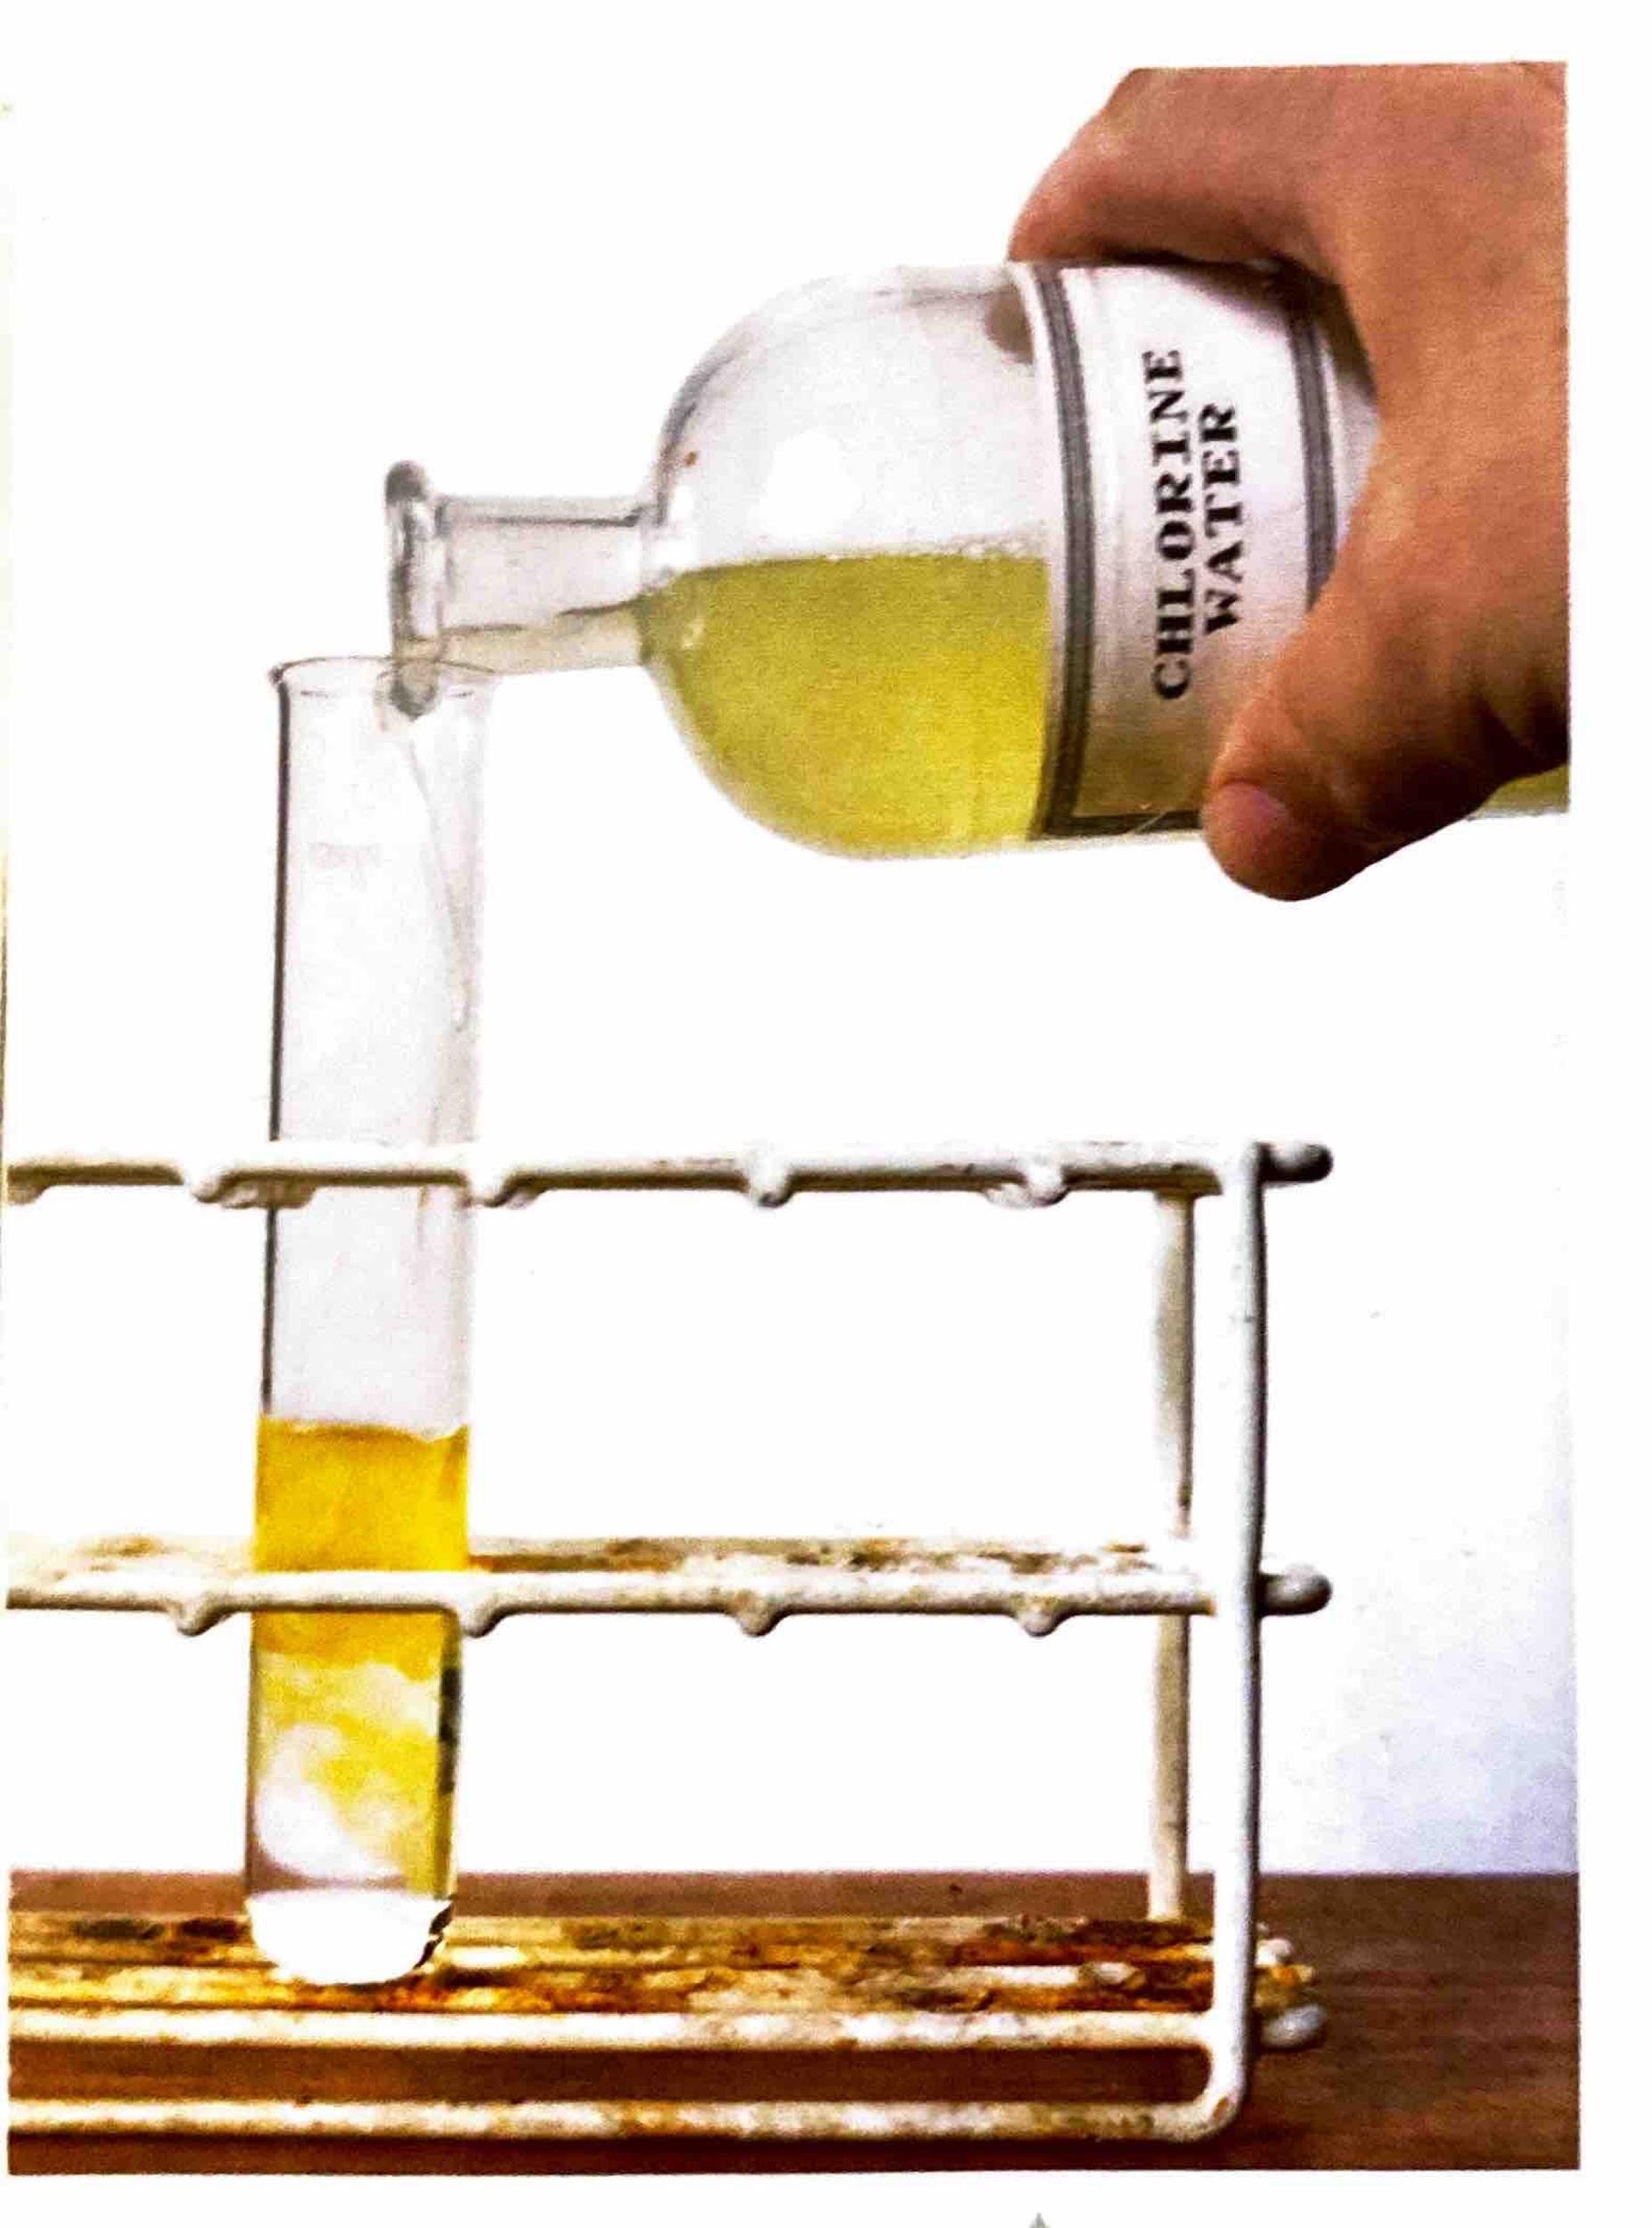
Displacement Reactions Involving Halogens

The relative reactivity of elements can be observed through displacement reactions, where elements compete for an electron. In the reaction between potassium bromide and chlorine, for example:
2KBr(aq) + Cl2(aq) → 2KCl(aq) + Br2(aq)
The net ionic equation for this reaction is: 2Br-(aq) + Cl2(aq) → 2Cl-(aq) + Br2(aq)
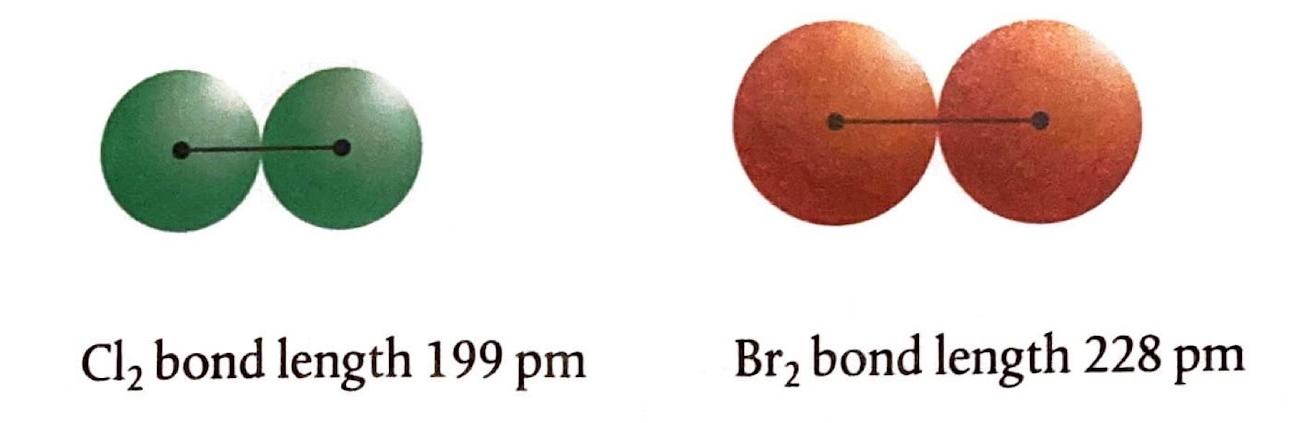
 In this case, the chlorine nucleus exerts a stronger attraction for an electron compared to bromine, primarily due to its smaller atomic radius. Consequently, chlorine gains an electron from the bromide ion to form a chloride ion, while the bromide ion loses an electron to form bromine. Similar displacement reactions occur with other halogens: 2I-(aq) + Cl2(aq) → 2Cl-(aq) + I2(aq)
2I-(aq) + Br2(aq) → 2Br-(aq) + I2(aq)
Generally, a more reactive halogen will displace the ion of a less reactive halogen from its compounds. It is also noteworthy that halogens form insoluble salts with silver. Therefore, adding a solution containing a halide ion to a solution of silver ions will result in the formation of a precipitate:
Ag+(aq) + X-(aq) → AgX(s)
Diagram

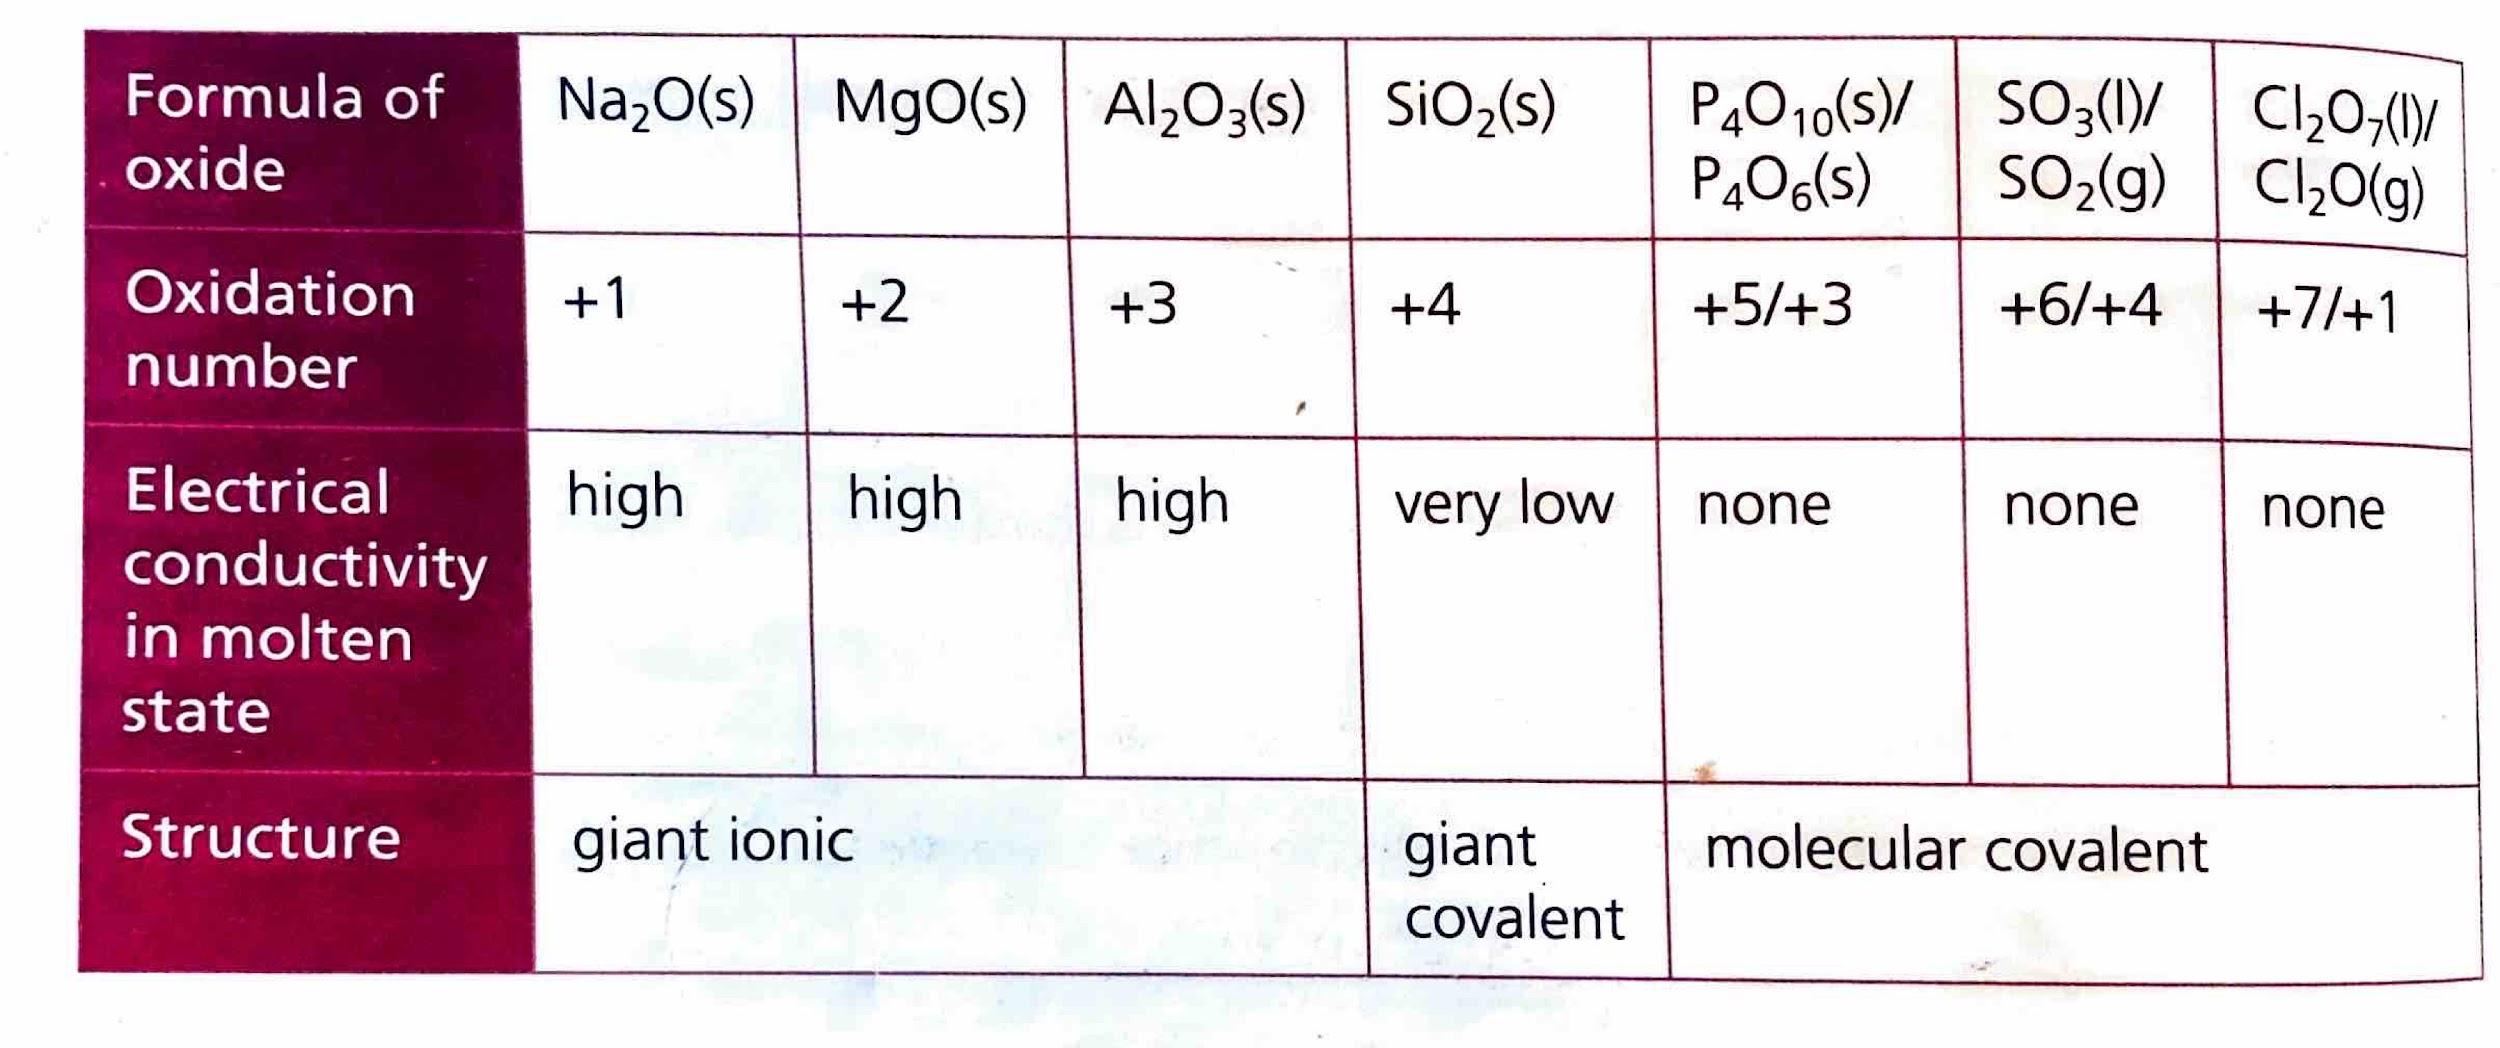
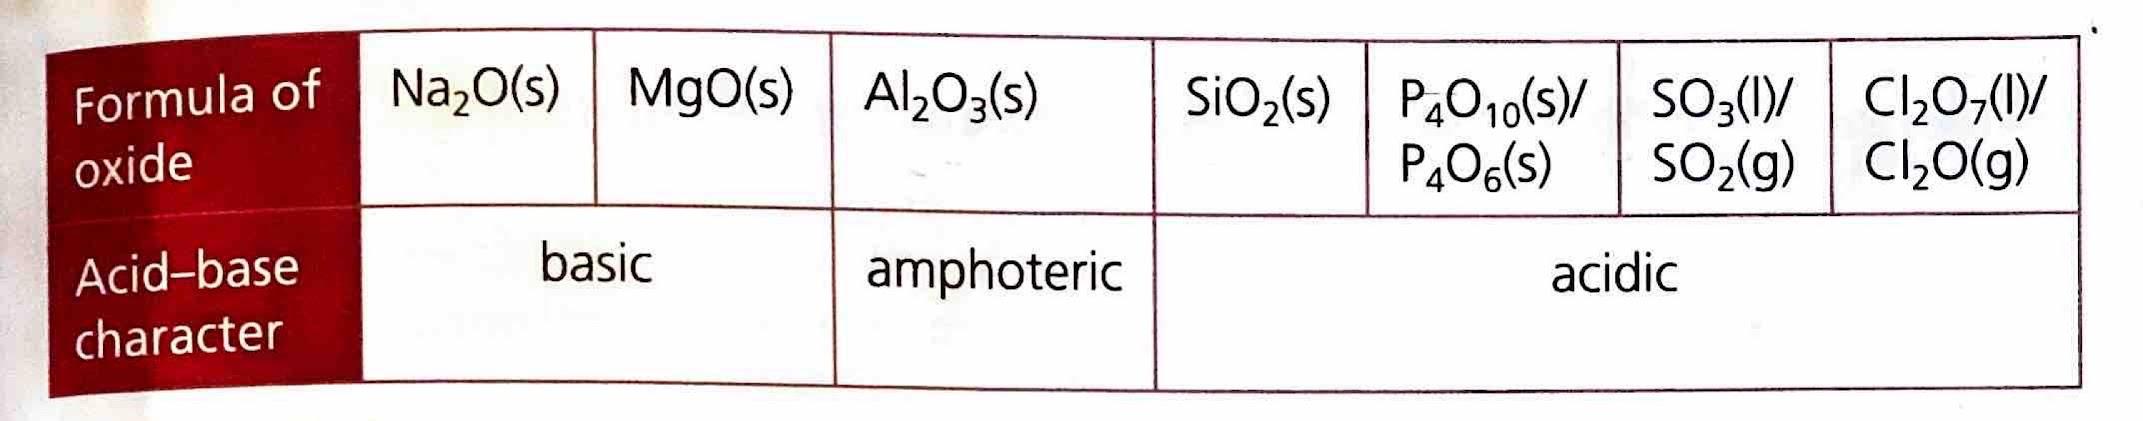
Bonding Characteristics of Period 3 Oxides

Elements in Period 3 frequently combine with oxygen to form various oxides. The ionic character of these oxides generally decreases from left to right across the period. This trend occurs because, while electronegativity increases across the period, the difference in electronegativity (ΔEN) between the Period 3 element and oxygen tends to decrease, leading to more covalent character. Conversely, the ionic character of oxides increases down a group, as the electronegativity of the metal decreases, resulting in larger ΔEN values with oxygen. The electrical conductivity of molten oxides provides an experimental measure of their ionic character; higher conductivity indicates a more ionic compound.
Diagram

Acid-Base Properties of Period 3 Oxides

The acid-base properties of Period 3 oxides are intrinsically linked to their bonding and structural characteristics. Metals, which typically form ionic oxides, tend to produce basic oxides. In contrast, nonmetals, which form covalent oxides, generally yield acidic oxides. Aluminum oxide (Al2O3) presents a unique case, exhibiting both ionic and covalent character. Consequently, it can act as both an acid and a base, a property known as amphoterism.
Diagram
Diagram
5
Covalent Bonding

The Nature of Covalent Bonds

Covalent bonds are formed when two non-metal atoms share one or more pairs of electrons. This sharing allows each atom to achieve a stable electron configuration, typically resembling that of a noble gas, which is a process that stabilizes the atoms and releases energy. A group of atoms held together by these shared electron pairs is known as a molecule. The stability of a covalent bond arises from a delicate balance: the attractive forces between the positively charged nuclei and the shared electrons are counteracted by the repulsive forces between the two nuclei, ultimately holding the atoms at a fixed distance apart, known as the bond length. This electrostatic attraction between the shared electron pair and the nuclei is the fundamental force underlying covalent bonding.
Diagram
Diagram

The Octet Rule in Covalent Bonding

The octet rule is a fundamental principle in chemistry stating that when atoms react, they tend to achieve an outer shell containing eight valence electrons. This stable configuration is often accomplished through the sharing of electrons in covalent bonds. While all electrons are identical, they are often depicted using different symbols in diagrams to distinguish between the electrons originating from different atoms involved in the bond.
Diagram
Diagram

Representing Shared Electron Pairs

Atoms can share more than one pair of electrons to achieve stable electron configurations. A single line drawn between two atomic symbols is a common convention used to represent a shared pair of electrons, or a single covalent bond. For example, H‒H denotes a single bond between two hydrogen atoms.
Diagram
Diagram
Diagram
Diagram
Diagram

Characteristics of Covalent Bonds: Length and Strength

Covalent bonds are characterized by two primary properties: bond length and bond strength. Bond length is defined as the measure of the distance between the nuclei of the two bonded atoms. Bond strength, on the other hand, is described in terms of bond enthalpy, which is the energy required to break a particular bond. Generally, double bonds are stronger than single bonds, though they are not precisely twice as strong. Several factors influence these properties. Bond length typically increases as one moves down a group in the periodic table because the atomic radius of the bonding atoms increases. Conversely, stronger attractive forces between the nuclei and shared electrons lead to shorter bond lengths.
Diagram
Diagram
Diagram

Anomalous Bond Strength Trends

While bond strength generally decreases down a group, as seen in the trend Cl-Cl > Br-Br > I-I due to decreasing electronegativity and increasing atomic radius, the F-F bond presents an interesting anomaly. Despite fluorine being at the top of Group 17, its bond strength is approximately the same as that of the I-I bond. This unexpected weakness in the F-F bond is attributed to the very small size of fluorine atoms. The non-bonding electron pairs on each fluorine atom are in close proximity, leading to significant electron-electron repulsion. This repulsion effectively weakens the F-F covalent bond, making it less stable than anticipated based on general periodic trends.
Diagram
Diagram
Diagram


  Understanding  Polar Covalent Bonds

A polar bond is an unsymmetrical covalent bond where the electrons are not shared equally between the two atoms. This unequal sharing arises when the covalent bond forms between atoms with different electronegativities. The atom with higher electronegativity attracts the shared electron pair more strongly, resulting in a partial negative charge (δ-) on that atom, while the less electronegative atom acquires a partial positive charge (δ+). This separation of charge creates a dipole, indicating that the bond possesses two opposite electric charges.
Diagram
Diagram

Factors Influencing Bond Polarity

The extent of a bond's polarity is directly dependent on the magnitude of the electronegativity difference between the two bonded atoms. For instance, in a bond involving oxygen, the electron density will be greater around the oxygen atom due to its high electronegativity. Dipole notation, often represented by an arrow pointing towards the more electronegative atom with a plus sign at the tail, is used to visually indicate the direction of electron density shift and the partial charges within a polar bond.
Diagram

The Continuum of Bonding: From Pure Covalent to Ionic

Pure covalent bonds, characterized by an electronegativity difference (ΔEN) of zero, occur between identical atoms, such as in diatomic molecules like O
Diagram
2, and are considered non-polar. However, all other bonds exhibit some degree of polarity. Even bonds like C‒H, often considered largely non-polar, possess a slight electronegativity difference. The presence of polar bonds significantly influences the overall properties of a molecule. As the polarity of a bond increases, the molecule's behavior increasingly resembles that of an ionic compound. It is important to recognize that the distinction between ionic and covalent bonds is not absolute but rather a continuum. Substances are therefore often described as "predominantly" ionic or covalent, or "strongly" polar, acknowledging that bonding exists along a spectrum rather than in discrete categories.
Diagram

Defining Boundaries in the Bonding Continuum

It is crucial to understand that the specific boundaries used to classify bonds along the ionic-covalent continuum are not universally fixed and can vary depending on the source or textbook. These classifications serve as useful guidelines but should be interpreted with the understanding that bonding is a continuous phenomenon.
Diagram
6
Covalent Structures

Giant Molecular Crystalline Solids: Network Covalent Structures

Giant molecular crystalline solids, also known as network covalent structures, are characterized by a crystalline lattice where atoms are extensively linked together by strong covalent bonds. Unlike discrete covalent molecules, these structures form a continuous network, leading to distinct physical and chemical properties. Examples of such structures include silicon dioxide (SiO2) and various allotropes of carbon, such as diamond, fullerene, graphite, and graphene. Allotropes are different structural forms of the same element in the same physical state, for instance, oxygen (O2) and ozone (O3) are allotropes of oxygen.

Silicon Dioxide (SiO2)

Silicon dioxide, or silica, forms a giant lattice structure analogous to that of diamond. The chemical formula SiO
Diagram
2 represents the simplest ratio of silicon to oxygen atoms within this vast molecular network, not a discrete molecule. In reality, the actual number of atoms present is a very large multiple of this ratio. Within the structure, silicon atoms are strongly held in tetrahedral positions. Each silicon atom is covalently bonded to four oxygen atoms, and conversely, each oxygen atom forms covalent bonds with two silicon atoms, effectively acting as a bridge between the tetrahedral silicon centers. This extensive network of strong covalent bonds imparts unique properties to silicon dioxide. It is a very strong material and is insoluble in water. Due to the high energy required to break these numerous covalent bonds, SiO2 exhibits a very high melting point. Furthermore, because all valence electrons are localized in covalent bonds and are not free to move, silicon dioxide is a non-conductor of electricity.

Allotropes of Carbon

Diagram
7
Lewis Structures
Diagram

Introduction to Lewis Structures

Lewis structures provide a convenient and widely used method for visually representing the bonding within covalent molecules. They utilize a simple dot notation to illustrate the valence electrons of each atom, showing how these electrons are shared in covalent bonds and identifying any non-bonding lone pairs. It is crucial to remember that all lone pairs must be explicitly shown in a Lewis structure, as they play a significant role in determining a molecule's geometry and reactivity.

Drawing Lewis Structures

The process of drawing Lewis structures involves several steps to ensure an accurate representation of the molecule's electron distribution.
Diagram

Example: Carbon Dioxide (CO2) Lewis Structure

To illustrate the application of these rules, let's consider the Lewis structure for carbon dioxide (CO2). Following the systematic approach, we can determine the arrangement of atoms and electrons that satisfies the octet rule for most atoms and minimizes formal charges.
Diagram

Lewis Structures for Polyatomic Ions

When drawing Lewis structures for polyatomic ions, an additional convention is used to indicate the overall charge of the ion. After constructing the Lewis structure, the entire structure is enclosed in square brackets, and the overall charge of the ion is written as a superscript outside these brackets. This notation clearly communicates that the charge is distributed across the entire ion, not localized on a single atom.
Diagram

Understanding Coordinate Bonds

Coordinate bonds, also known as dative bonds, are a specific type of covalent bond where both electrons in the shared pair originate from the same atom. While they are fundamentally no different from other covalent bonds once formed, their origin can be important when interpreting certain reaction mechanisms. Sometimes, an arrow is used to represent a coordinate bond, with the arrow pointing from the electron-donating atom to the electron-deficient atom, indicating the direction of electron donation.
Diagram

Example: Hydronium Ion (H3O+) Coordinate Bond

A classic example of a molecule featuring a coordinate bond is the hydronium ion (H3O+). In this ion, a water molecule (H2O) donates a lone pair of electrons to a proton (H+), forming a new O-H bond.
Diagram

Exceptions to the Octet Rule: Incomplete Octets

While the octet rule is a powerful guideline for predicting bonding, there are instances where atoms do not achieve a full octet of eight valence electrons. Small atoms, particularly beryllium (Be) and boron (B), can form stable molecules where the central atom has fewer than eight valence electrons. Such molecules are described as having incomplete octets and are considered electron deficient. Consequently, they tend to act as Lewis acids, readily accepting an electron pair from another molecule that possesses a lone pair. It is important to note that hydrogen atoms always form only one bond and are therefore always in a terminal position, never serving as a central atom in a molecule.
Diagram
Diagram
Diagram
Diagram
8
VSEPR Theory & Molecular Shapes

Understanding the Core Principles of VSEPR Theory

Valence Shell Electron Pair Repulsion (VSEPR) theory is a fundamental concept in chemistry that explains the three-dimensional shapes of molecules. This theory is based on the principle that electron pairs, whether bonding or non-bonding, repel each other and will arrange themselves as far apart as possible to minimize these repulsions. The resulting 3-D shapes are crucial for understanding a molecule's reactivity and physical properties.

In VSEPR theory, the term "electron pairs" broadly refers to "electron domains." An electron domain can be a lone pair of electrons, a single bond, a double bond, or a triple bond. The total number of these electron domains around a central atom dictates the electron domain geometry. The actual shape of the molecule, known as the molecular geometry, is then determined by the angles between the bonded atoms.

It is important to note that not all electron domains exert the same amount of repulsion. Lone pairs, due to their higher concentration of charge and less constrained nature, cause slightly more repulsion than bonding pairs. This difference in repulsive forces leads to a specific order of repulsion between electron domains:

  • lone pair-lone pair > lone pair-bonding pair > bonding pair-bonding pair

Common Electron Domain Geometries

Diagram

Based on the number of electron domains around a central atom, several fundamental electron domain geometries emerge:

  • Linear: Occurs when there are two electron domains.
  • Trigonal Planar: Occurs when there are three electron domains.
  • Tetrahedral: Occurs when there are four electron domains.

These basic geometries serve as the foundation for determining more complex molecular shapes.

Diagram

Distinguishing Electron Domain and Molecular Geometry

While the electron domain geometry is determined by the presence of all electron domains (both bonding and non-bonding), the molecular geometry is solely defined by the positions of the bonding pairs around the central atom. The presence of lone pairs on the central atom significantly influences the molecular geometry because their greater repulsion alters the bond angles slightly. Consequently, if a central atom has lone pairs, its electron domain geometry and molecular geometry will not be the same.

Diagram
Diagram

For instance, both ammonia (NH3) and the ammonium ion (NH4+) have a tetrahedral electron domain geometry because both have four electron domains around the central nitrogen atom. However, NH3 has one lone pair and three bonding pairs, while NH4+ has four bonding pairs and no lone pairs. The lone pair on NH3 causes slightly smaller bond angles compared to the ideal 109.5° of a perfect tetrahedron, resulting in a trigonal pyramidal molecular geometry for NH3, whereas NH4+ retains a tetrahedral molecular geometry. The following tables summarizes various electron domain and molecular geometries based on the number of electron domains and lone pairs:


Diagram
Diagram


Molecular Polarity: Beyond Bond Polarity

The polarity of a molecule is a crucial property that influences its physical and chemical behavior. While the polarity of an individual bond depends on the charge separation between the two bonded atoms (due to differences in electronegativity), the overall polarity of a molecule is determined by two factors: the polarity of the bonds it contains and the spatial orientation of these polar bonds relative to each other.

A molecule can contain polar bonds but still be nonpolar overall if these polar bonds are arranged symmetrically, causing their individual dipole moments to cancel each other out. In such cases, the molecule will not possess a net dipole moment. Conversely, if a molecule contains bonds of different polarity or if its polar bonds are not arranged symmetrically, their dipole moments will not cancel. This results in a net dipole moment, making the molecule polar. A molecule with a net dipole moment will experience a turning force when placed in an electric field.

Diagram
Diagram
9
Metallic Bonding

The Nature of Metallic Bonding

Metals, predominantly located on the left side of the Periodic Table, are characterized by having a small number of valence electrons and low ionization energies. This predisposition means they readily lose their valence electrons to form positively charged ions, or cations. In their elemental state, these valence electrons are not confined to individual atoms but become delocalized, forming a "sea" of electrons that can move freely throughout the metallic structure. The metal ions, now positively charged due to the loss of these electrons, arrange themselves into a regular lattice structure. The fundamental metallic bond is then defined as the strong electrostatic force of attraction that exists between this lattice of positively charged metal cations and the surrounding mobile, delocalized electrons. These electrons are not fixed in position but are constantly moving, contributing to the unique properties of metals.
Diagram

Factors Influencing Metallic Bond Strength

The strength of a metallic bond is primarily determined by three key factors: the number of delocalized electrons contributed by each atom, the charge on the resulting metal cation, and the radius of the cation. Generally, a greater number of delocalized electrons and a higher positive charge on the cation lead to stronger electrostatic attractions and thus stronger metallic bonds. Conversely, a larger cation radius tends to weaken the bond due to the increased distance between the nucleus and the delocalized electrons. These factors explain observed trends in metallic properties, such as melting points. For instance, melting points of metals typically increase when moving across a period in the Periodic Table, as the number of valence electrons available for delocalization generally increases, and cation charge tends to rise. Conversely, melting points tend to decrease down a group due to the increasing atomic radius. Transition elements, in particular, exhibit very strong metallic bonds because they can contribute a large number of electrons from both their 3d and 4s sublevels to the delocalized electron sea.
Diagram
Diagram
Diagram

Characteristic Properties of Metals

The unique physical properties of metals are a direct consequence of the nature of metallic bonding. The "sea" of delocalized electrons allows for excellent electrical and thermal conductivity, as these mobile electrons can readily transfer charge and kinetic energy throughout the material. The strong, non-directional electrostatic attraction between the cations and the electron sea also accounts for the malleability (ability to be hammered into sheets) and ductility (ability to be drawn into wires) of metals. When a force is applied, the layers of cations can slide past one another without disrupting the overall metallic bond, as the delocalized electron sea simply re-establishes the attraction.
Diagram

Understanding Alloys and Their Properties

Alloys are solid solutions that typically consist of more than one metal, or a metal combined with a non-metal like carbon, held together by metallic bonding. They are produced by melting the constituent elements together and allowing the mixture to solidify. During this process, the ions of the different metals become scattered throughout the lattice, and they are all bound together by the shared delocalized electrons. The formation of alloys is possible due to the non-directional nature of the delocalized electrons, which can accommodate different types of cations, and because the metallic lattice can often incorporate ions of varying sizes without significant structural strain. Alloys possess properties that are distinct from their component elements. This often arises from differences in the packing of cations within the lattice, which can impede the movement of dislocations, leading to increased hardness and strength. Furthermore, alloys are frequently more chemically stable and exhibit greater resistance to corrosion compared to their pure metallic counterparts.
Diagram
Diagram
10
Intermolecular Forces

Introduction to Intermolecular Forces

Intermolecular forces are the attractive forces that exist between molecules, as opposed to intramolecular forces which are the forces within molecules (i.e., chemical bonds). These forces, often collectively referred to as van der Waals' forces, encompass all attractions between molecules that do not involve electrostatic interactions between ions or the formation of chemical bonds. The strength of these intermolecular forces is a critical determinant of a substance's physical properties, influencing characteristics such as volatility, solubility, and conductivity.
Diagram
Diagram
Diagram
Diagram
Diagram

London Dispersion Forces

London dispersion forces are weak attractive forces that arise from the temporary, instantaneous dipoles formed in molecules. An instantaneous dipole occurs when, at any given moment, the electron cloud density within an atom or molecule becomes unevenly distributed, creating a momentary separation of charge. This temporary dipole can then induce a corresponding dipole in a neighboring atom or molecule, leading to a weak, transient attraction between the opposite ends of these temporary dipoles. These forces are the only type of intermolecular force present between nonpolar molecules. Consequently, substances held together solely by London dispersion forces generally exhibit low melting and boiling points, which explains why many nonpolar elements and compounds exist as gases at room temperature. It is important to note that London dispersion forces are universally present between all molecules, regardless of whether other, stronger intermolecular forces also exist. Therefore, when asked to identify the intermolecular forces acting between molecules, London dispersion forces should always be included in the list.
Diagram

Dipole-Dipole Attractions

Dipole-dipole attractions occur between molecules that possess a permanent dipole. A permanent dipole arises in molecules where there is a persistent separation of charge due to differences in electronegativity between bonded atoms. This results in one end of the molecule having a partial positive charge (δ+) and the other end having a partial negative charge (δ-). The attraction then occurs between the partially positive end of one molecule and the partially negative end of an adjacent molecule. These forces are generally stronger than London dispersion forces, and as a result, polar compounds typically have higher melting and boiling points compared to nonpolar substances of comparable molecular masses. The strength of dipole-dipole interactions can vary depending on the distance and orientation of the interacting dipoles.
Diagram

Dipole-Induced Dipole Interactions

Dipole-induced dipole interactions occur when a molecule with a permanent dipole interacts with a nonpolar molecule. The electric field of the permanent dipole can distort the electron cloud of the nonpolar molecule, inducing a temporary dipole within it. This induced dipole then experiences an attractive force with the permanent dipole. The strength of this interaction is dependent on how easily the electron cloud of the nonpolar molecule can be distorted, a property known as polarizability. Larger molecules, with their more diffuse electron clouds, are generally more susceptible to induced dipoles than smaller molecules because their electrons are not held as tightly to the nuclei.
Diagram
Diagram


Diagram

Hydrogen Bonding

Hydrogen bonding represents the strongest type of intermolecular attraction. It occurs when a hydrogen atom, covalently bonded to a highly electronegative atom (specifically oxygen, fluorine, or nitrogen), is attracted to a lone pair of electrons on a neighboring electronegative atom (also oxygen, fluorine, or nitrogen) in another molecule. This strong interaction leads to significantly higher boiling points than would be predicted based solely on molar mass.
Diagram
Diagram
Diagram
For example, while boiling points generally increase down a group in the periodic table as molar mass increases, compounds like NH3, HF, and H2O exhibit anomalously high boiling points due to the presence of hydrogen bonding. Similarly, organic molecules containing O-H or N-H bonds also display higher boiling points because of these strong intermolecular forces.
Diagram

Diagram


Summary of Intermolecular Forces

Diagram
11
Physical Properties & IMFs

Impact of Intermolecular Forces on Melting and Boiling Points

The melting and boiling points of a substance are directly influenced by the strength of its intermolecular forces (IMFs). Stronger IMFs require a greater amount of energy to overcome, resulting in higher melting and boiling points. Conversely, substances with weaker IMFs will have lower melting and boiling points. Covalent substances, for instance, generally exhibit lower melting and boiling points due to the relatively weak nature of their intermolecular forces. This explains why many covalent compounds exist as liquids or gases at room temperature. For covalent compounds, melting and boiling points tend to increase with increasing molecular size and the extent of polarity within the molecule, as these factors contribute to stronger IMFs.

Solubility and the "Like Dissolves Like" Principle

Solubility is governed by the principle of "like dissolves like," meaning substances with similar intermolecular forces tend to dissolve in one another. Nonpolar substances typically dissolve in nonpolar solvents because London dispersion forces can form between the solute and solvent molecules. For example, halogens readily dissolve in paraffin oil. Conversely, polar covalent compounds are generally soluble in highly polar solvents like water, as they can form dipole-dipole interactions and hydrogen bonds with water molecules. Examples include the aqueous solubility of hydrogen chloride (HCl), glucose, and ethanol. It is noteworthy that many biological systems are based on polar covalent molecules dissolved in an aqueous environment.
Diagram
Diagram
The solubility of polar compounds can be significantly reduced in larger molecules where only a small portion of the total structure is polar. The presence of large nonpolar parts within a molecule diminishes its solubility in water. For instance, ethanol (C2H5OH) is soluble in water, but the larger molecule heptanol (C7H15OH) is not, due to its much larger nonpolar hydrocarbon group. Conversely, nonpolar covalent substances, such as nitrogen (N
Diagram
2), exhibit low solubility in water. Similarly, polar substances have low solubility in nonpolar solvents because their strong dipole-dipole interactions hold them together, preventing effective interaction with the nonpolar solvent. Giant molecular substances are generally insoluble in all solvents because an immense amount of energy would be required to break the strong covalent bonds within their structure.
Diagram

Electrical Conductivity of Covalent Substances

Electrical conductivity in substances is primarily dependent on the presence of mobile charge carriers, such as ions or delocalized electrons. Covalent compounds, by their nature, do not contain ions and therefore do not conduct electricity in either their solid or liquid states. However, some polar covalent molecules can ionize under specific conditions, enabling them to conduct electricity. A classic example is hydrogen chloride (HCl) dissolved in water, where it dissociates into H+(aq) and Cl-(aq) ions, allowing the solution to conduct electricity. Furthermore, certain giant covalent compounds can conduct electricity if they possess mobile electrons. Graphite and graphene, for instance, are excellent electrical conductors due to their delocalized electrons. Fullerene and silicon exhibit semiconductive properties, while diamond, with its tightly bound electrons, is a non-conductor of electricity.

Summary of Physical Properties and Intermolecular Forces

The table below summarizes the relationship between intermolecular forces and the physical properties discussed.
Physical Property Effect of Stronger Intermolecular Forces Effect of Weaker Intermolecular Forces
Melting/Boiling Point Higher Lower
Solubility in Polar Solvents Higher (for polar solutes) Lower (for nonpolar solutes)
Solubility in Nonpolar Solvents Lower (for polar solutes) Higher (for nonpolar solutes)
Electrical Conductivity Generally non-conductive (unless ions or mobile electrons are present) Generally non-conductive
Diagram
12
Paper Chromatography

Introduction to Paper Chromatography

Paper chromatography is a qualitative analytical technique employed to separate the individual components of a mixture. This separation is achieved through the differential distribution of components between two distinct phases: a stationary phase and a mobile phase. This method is particularly effective for separating various dyes and pigments.

Diagram

The solubility characteristics of the components play a crucial role in their separation. Substances that dissolve readily in polar solvents are typically polar themselves, while those that do not dissolve in polar solvents are generally non-polar.

The Experimental Procedure of Paper Chromatography

Diagram
Diagram

The process of paper chromatography begins by drawing a pencil line near one end of a piece of chromatography paper. This line serves as the origin or starting point for the mixture and ensures that the distance traveled by the components can be accurately measured. The chromatography paper itself acts as the stationary phase because it remains fixed throughout the experiment.

Next, a small amount of the mixture to be separated is carefully applied as small spots onto the pencil line. An appropriate solvent, which will act as the mobile phase, is then selected. The end of the chromatography paper is subsequently placed into this solvent, ensuring that the solvent level is below the pencil line. As the solvent ascends the paper by capillary action, it carries the components of the mixture with it. Since the solvent moves, it is designated as the mobile phase.

Once the mobile phase has traveled a sufficient distance up the paper and the mixture components have separated, the paper is removed from the solvent and allowed to dry. The resulting separated pattern of spots on the paper is known as a chromatogram. This chromatogram can then be compared to known reference values to identify the individual components of the original mixture.

It is important to distinguish between absorption and adsorption in this context. Absorption occurs when a chemical species penetrates and is taken up by the bulk of a material, whereas adsorption refers to a chemical species adhering only to the surface of a material. In paper chromatography, both phenomena can play a role, with components interacting with the surface of the paper (adsorption) and potentially penetrating its pores (absorption).

Diagram

Principles of Separation and Retention Factor (Rf)

The separation of components in paper chromatography relies on the differential attraction of each component to either the mobile phase or the stationary phase, which is governed by the intermolecular forces present. Components of the mixture that exhibit similar polarity to the mobile phase will travel further up the paper with the solvent. Conversely, components that have stronger intermolecular forces with the stationary phase (e.g., a polar component interacting with the polar cellulose of the paper) will be retained more effectively and thus travel a shorter distance.

Diagram

The retention factor (Rf) is a quantitative measure used to characterize the movement of a specific component. It is defined as the ratio of the distance traveled by the spot to the distance traveled by the solvent front. The Rf value is always between 0 and 1. A higher Rf value indicates that the component has a greater affinity for the mobile phase and travels further, while a lower Rf value suggests a stronger interaction with the stationary phase. Crucially, for a given stationary phase and mobile phase, the Rf value for a particular compound will remain constant, regardless of the total travel time.

Compounds with different strengths of intermolecular forces will move at different rates. Stronger intermolecular forces between a compound and the stationary phase will cause the compound to remain adsorbed for a longer period, resulting in a smaller distance traveled and a lower Rf value.

Diagram

Qualitative Analysis and Limitations

Paper chromatography primarily provides qualitative rather than quantitative data. While it can identify the presence of substances, it does not typically provide information about the amount or concentration of each substance in the mixture. For instance, observing a single spot on the chromatogram indicates a pure substance, whereas multiple spots signify an impure substance.

By comparing the color, location, and number of spots between different samples, valuable information about their identity can be inferred. Although Rf values provide numerical data, they are used for identification and comparison rather than for determining the quantity of a substance, thus reinforcing the qualitative nature of this technique.

Observation Interpretation
One spot observed Pure substance
Multiple spots observed Impure substance
Comparing color, location, and number of spots Provides information about the identity of components
Rf values Numerical data for identification, not quantification
13
Ozone

The Nature and Importance of Ozone

Ozone (O3) is an allotrope of oxygen, meaning it is a different structural form of the same element. This molecule is an essential component of the stratosphere, where it plays a critical role in determining the temperature structure of Earth's atmosphere. Despite its seemingly symmetrical structure, ozone possesses a bent molecular geometry. Although one might initially assume it to be nonpolar, ozone is, in fact, a polar molecule. This polarity arises from an uneven distribution of electrons within the molecule, which can be understood by examining the formal charges on its constituent atoms.

Ozone's Role in UV Radiation Absorption

Oxygen (O
Diagram
2) requires shorter wavelengths of light to break its bonds because it has stronger bonds compared to ozone. This difference in bond strength is crucial for ozone's protective function. Ozone is uniquely capable of absorbing harmful ultraviolet (UV) radiation, specifically UV-B (280 nm - 315 nm) and UV-C (200 nm - 280 nm) wavelengths. By absorbing these high-energy photons, ozone shields life on Earth from the tissue-damaging effects of this radiation.
Diagram

The Stratospheric Ozone Layer and its Formation

Ozone is predominantly found in the stratosphere, forming what is commonly known as the ozone layer. The levels of ozone in this layer are maintained through a dynamic cycle of reactions involving the breakdown and formation of both oxygen and ozone. As mentioned, oxygen molecules contain stronger bonds than ozone, and thus require shorter, higher-energy wavelengths of light to dissociate. The formation of ozone involves the reaction of an oxygen molecule with an oxygen free radical: O
Diagram
2(g) + O•(g) → O3(g).

The Ozone-Oxygen Cycle

The continuous regeneration of ozone is part of a vital cycle that involves the photodissociation of oxygen and the subsequent formation and breakdown of ozone. This cycle ensures a steady concentration of ozone in the stratosphere, maintaining its protective shield against harmful UV radiation.
Diagram

Catalytic Destruction of Ozone

While ozone's ability to absorb UV radiation is beneficial, it also makes the molecule inherently unstable and highly reactive. This instability means ozone readily reacts with various pollutants present in the atmosphere, such as nitrogen oxides (NO
Diagram
x) and chlorofluorocarbons (CFCs). These pollutants produce free radicals, such as nitric oxide radicals (NO•) and chlorine radicals (Cl•), which act as catalysts in the decomposition of ozone. The net reaction for this catalytic destruction shows that these radicals are consumed and regenerated, allowing them to destroy many ozone molecules.
Diagram
Diagram
Diagram
Diagram
Diagram