IB Chemistry Study Summary

Acids and Bases

1
Lewis Acids & Bases
Diagram

Defining Lewis Acids and Bases

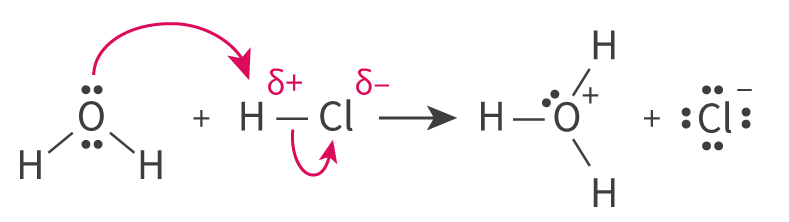
In the context of Lewis acid-base theory, a Lewis acid is characterized as a species that can accept a lone pair of electrons, while a Lewis base is a species capable of donating a lone pair of electrons. It is crucial to remember that these definitions refer to the movement of an entire electron pair, not just a single electron. The interaction between a Lewis acid and a Lewis base results in the formation of a coordinate bond, where both electrons in the bond are contributed by the Lewis base.
Diagram

Characteristics of Lewis Acids

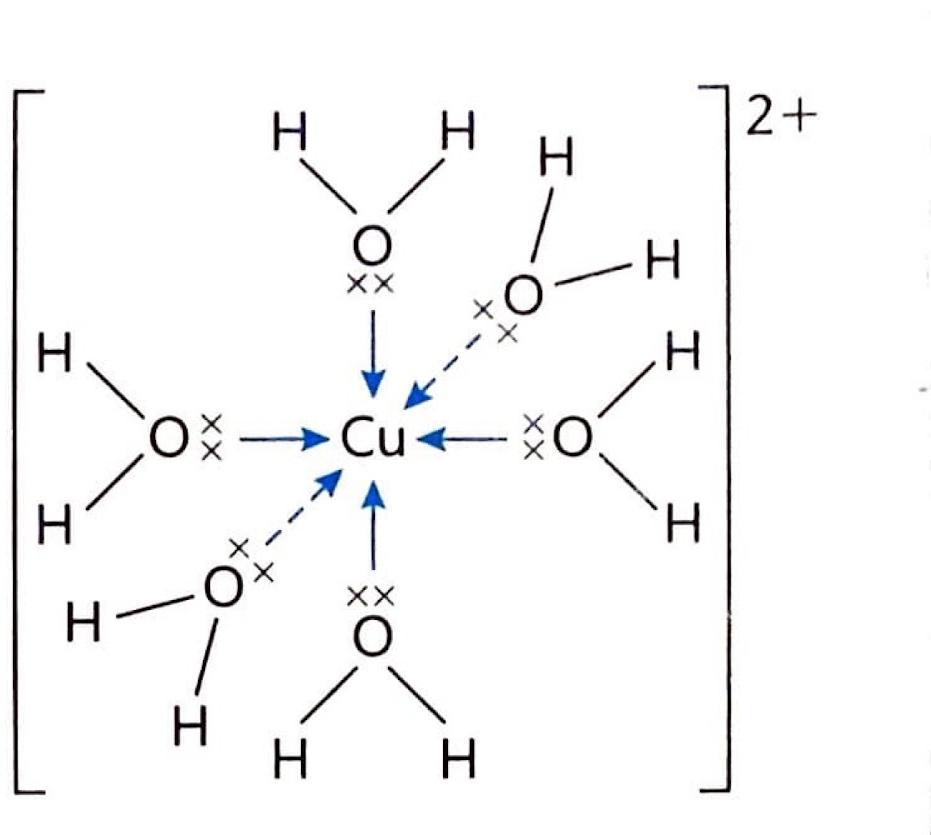
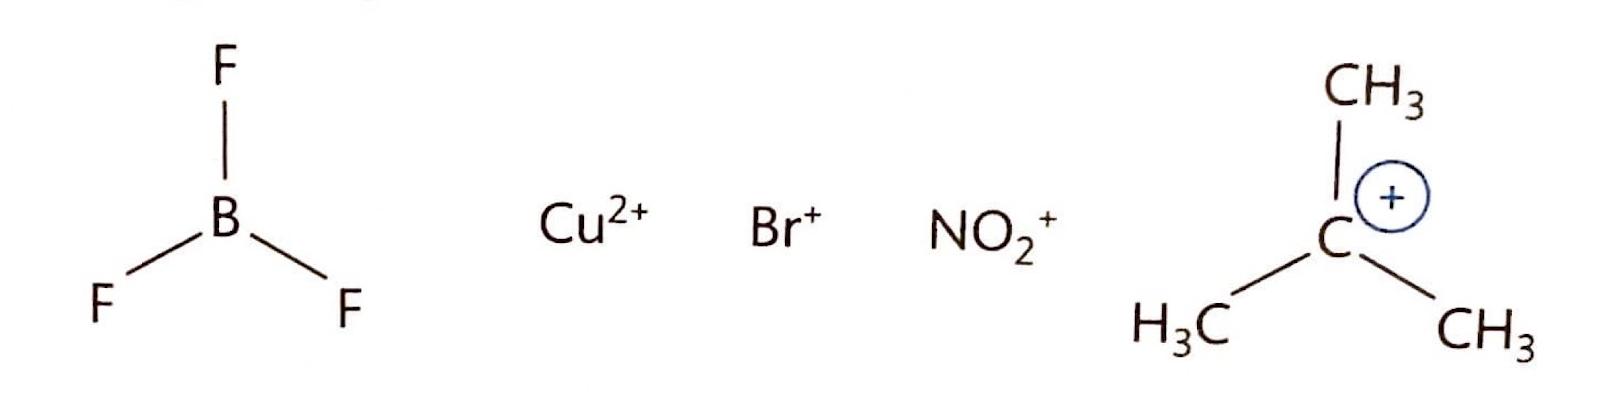
Molecules possessing incomplete octets are frequently strong Lewis acids due to their electron deficiency. Furthermore, transition metals often act as Lewis acids because their ions typically have incomplete d orbitals, allowing them to accept electron pairs. These transition metal ions readily bond with ligands to form complex ions. A classic example is the reaction of aqueous copper(II) ions with water molecules:
Diagram

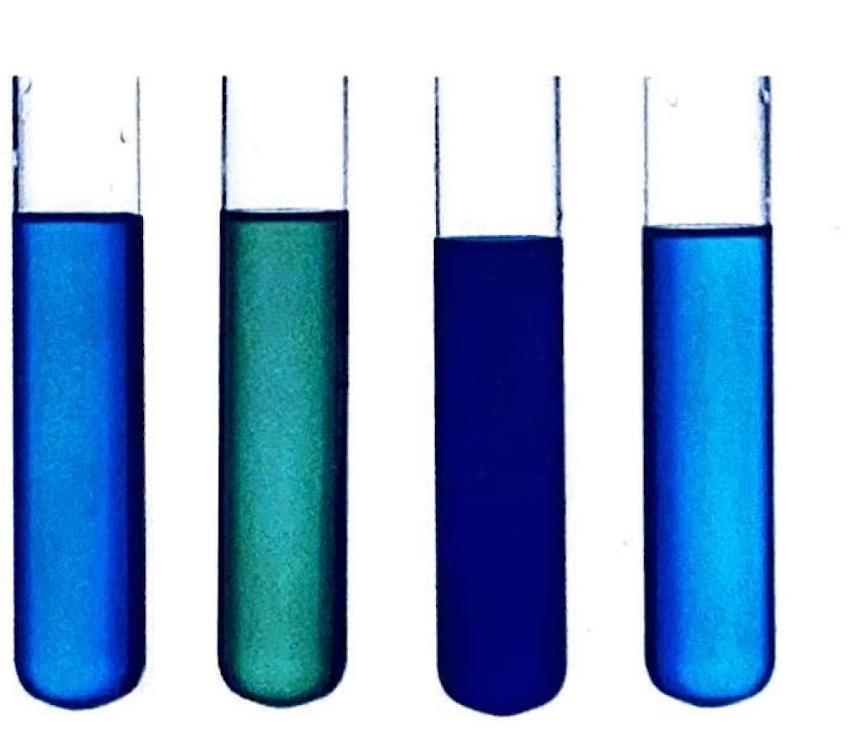
Cu2+(aq) + 6H2O(l) → [Cu(H2O)6]2+(aq). The formation of different complex ions, particularly with copper, is often associated with distinct and vibrant colors.
Diagram


Ligands, Complexes, and Coordination Number

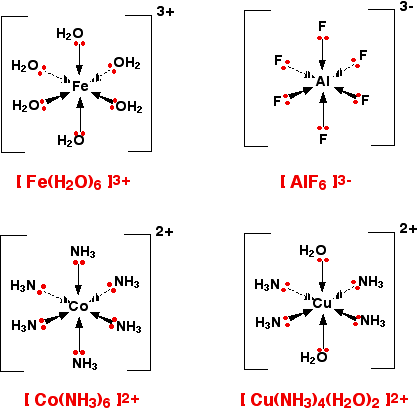
A ligand is defined as a molecule or ion that forms a coordinate bond with a central transition metal atom or ion by donating a pair of electrons. The resulting structure, where a transition metal is centrally located and surrounded by these ligands, is known as a complex. The coordination number of a complex refers to the total number of coordinate bonds formed between the ligands and the central transition metal.
Diagram


Coloration of Copper Ions

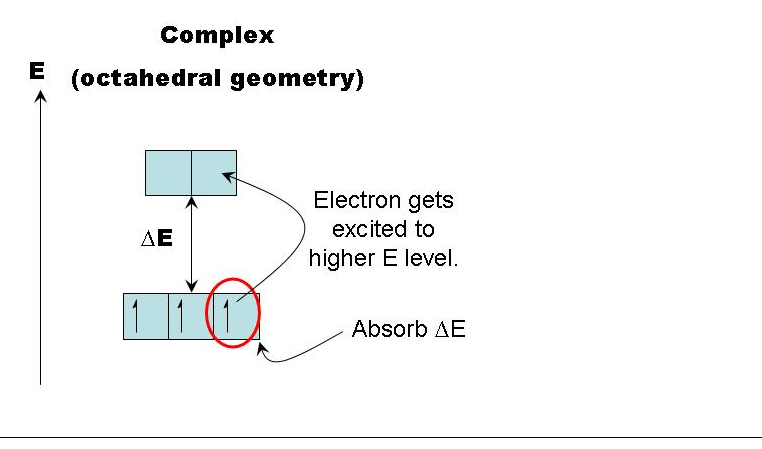
 The hexaaquacopper(II) ion, [Cu(H2O)6]2+, typically presents a blue color in aqueous solution. This observed blue color arises because the solution absorbs light in the orange (red and yellow) region of the electromagnetic spectrum, allowing the complementary blue light to be transmitted or reflected. Information regarding the properties and colors of various ions can often be found in Section 17 of chemistry data booklets.
Diagram


Diagram

Diagram
Diagram
Diagram
Diagram

Understanding Crystal Field Theory

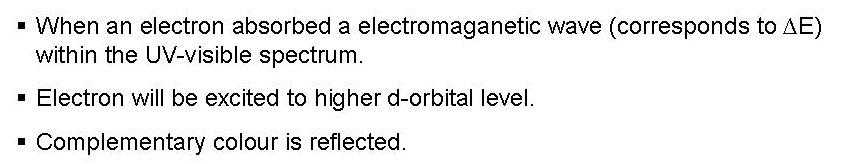
Crystal field theory provides an explanation for the characteristic properties of complex ions, particularly their color and magnetic behavior. This theory posits that when ligands approach a central metal ion, the repulsion between the lone pairs of electrons on the ligands and the electrons in the d orbitals of the central metal ion causes a splitting of the d orbitals into two sets of different energy levels. This uneven repulsion results in two d orbitals having higher energy and three d orbitals having lower energy.
Diagram

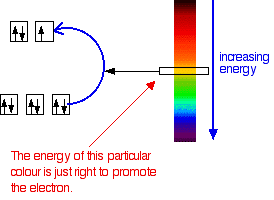
Incomplete d Subshells in Transition Metals

Transition metals are characterized by having incomplete d subshells, which is a key factor contributing to their ability to form complex ions and exhibit variable oxidation states.

Transition Metals as Lewis Acids in Complex Formation

As previously mentioned, transition metals frequently act as Lewis acids due to their incomplete d orbitals, enabling them to accept electron pairs from ligands. This interaction leads to the formation of complex ions, such as the reaction between aqueous copper(II) ions and water to form the hexaaquacopper(II) complex: Cu2+(aq) + 6H2O(l) → [Cu(H2O)6]2+(aq). The specific ligands and the central metal ion determine the distinct colors observed for different complex ions of copper. 
Diagram

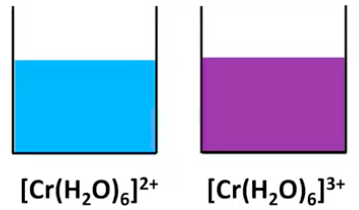
Factors Influencing Complex Ion Colors

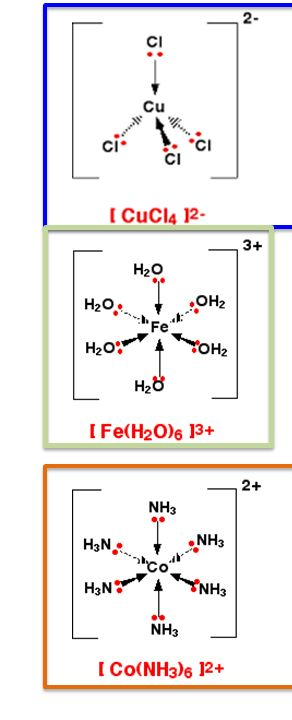
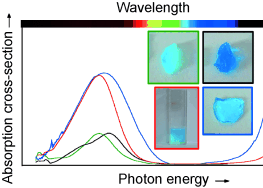
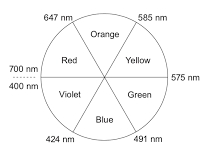
The color of a complex ion is directly related to the energy difference between the split d orbitals. Any factor that alters this energy difference will consequently change the wavelengths of light absorbed when an electron transitions from a lower-energy d orbital to a higher-energy d orbital. Key factors influencing complex ion colors include:
Diagram
    • The identity of the central metal ion.
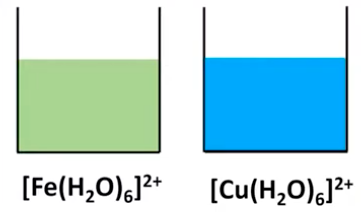
    • The oxidation state of the central metal ion.
    • The geometry of the complex ion.
    • The identity of the ligands, which can be ordered     according to the spectrochemical series based on their     ability to cause d-orbital splitting.

Determining the Charge of Complex Ions

The overall charge of a complex ion is determined by the sum of the charges of the central metal ion and all the ligands attached to it. For instance, if a central metal ion M has a charge of +2 (e.g., Cu2+) and is coordinated with six neutral ligands (e.g., H2O), the overall charge of the complex will be +2. However, if the same Cu2+ ion were coordinated with two hydroxide ligands (OH-), the overall charge would be 2+ + 2(-1) = 0, resulting in a neutral complex.
Diagram
Diagram

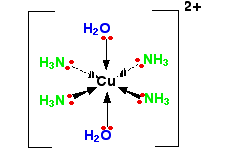
Nucleophiles and Electrophiles

Nucleophiles are electron-rich species that donate a lone pair of electrons to form a new covalent bond in a chemical reaction; they are essentially Lewis bases. Conversely, electrophiles are electron-deficient species that accept a lone pair of electrons from another reactant to form a new covalent bond; thus, they function as Lewis acids.
Diagram
Diagram


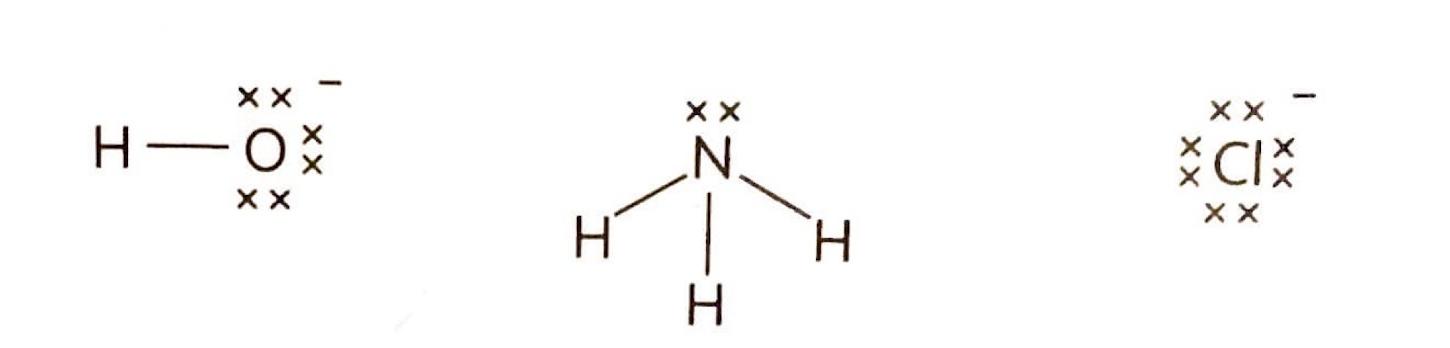
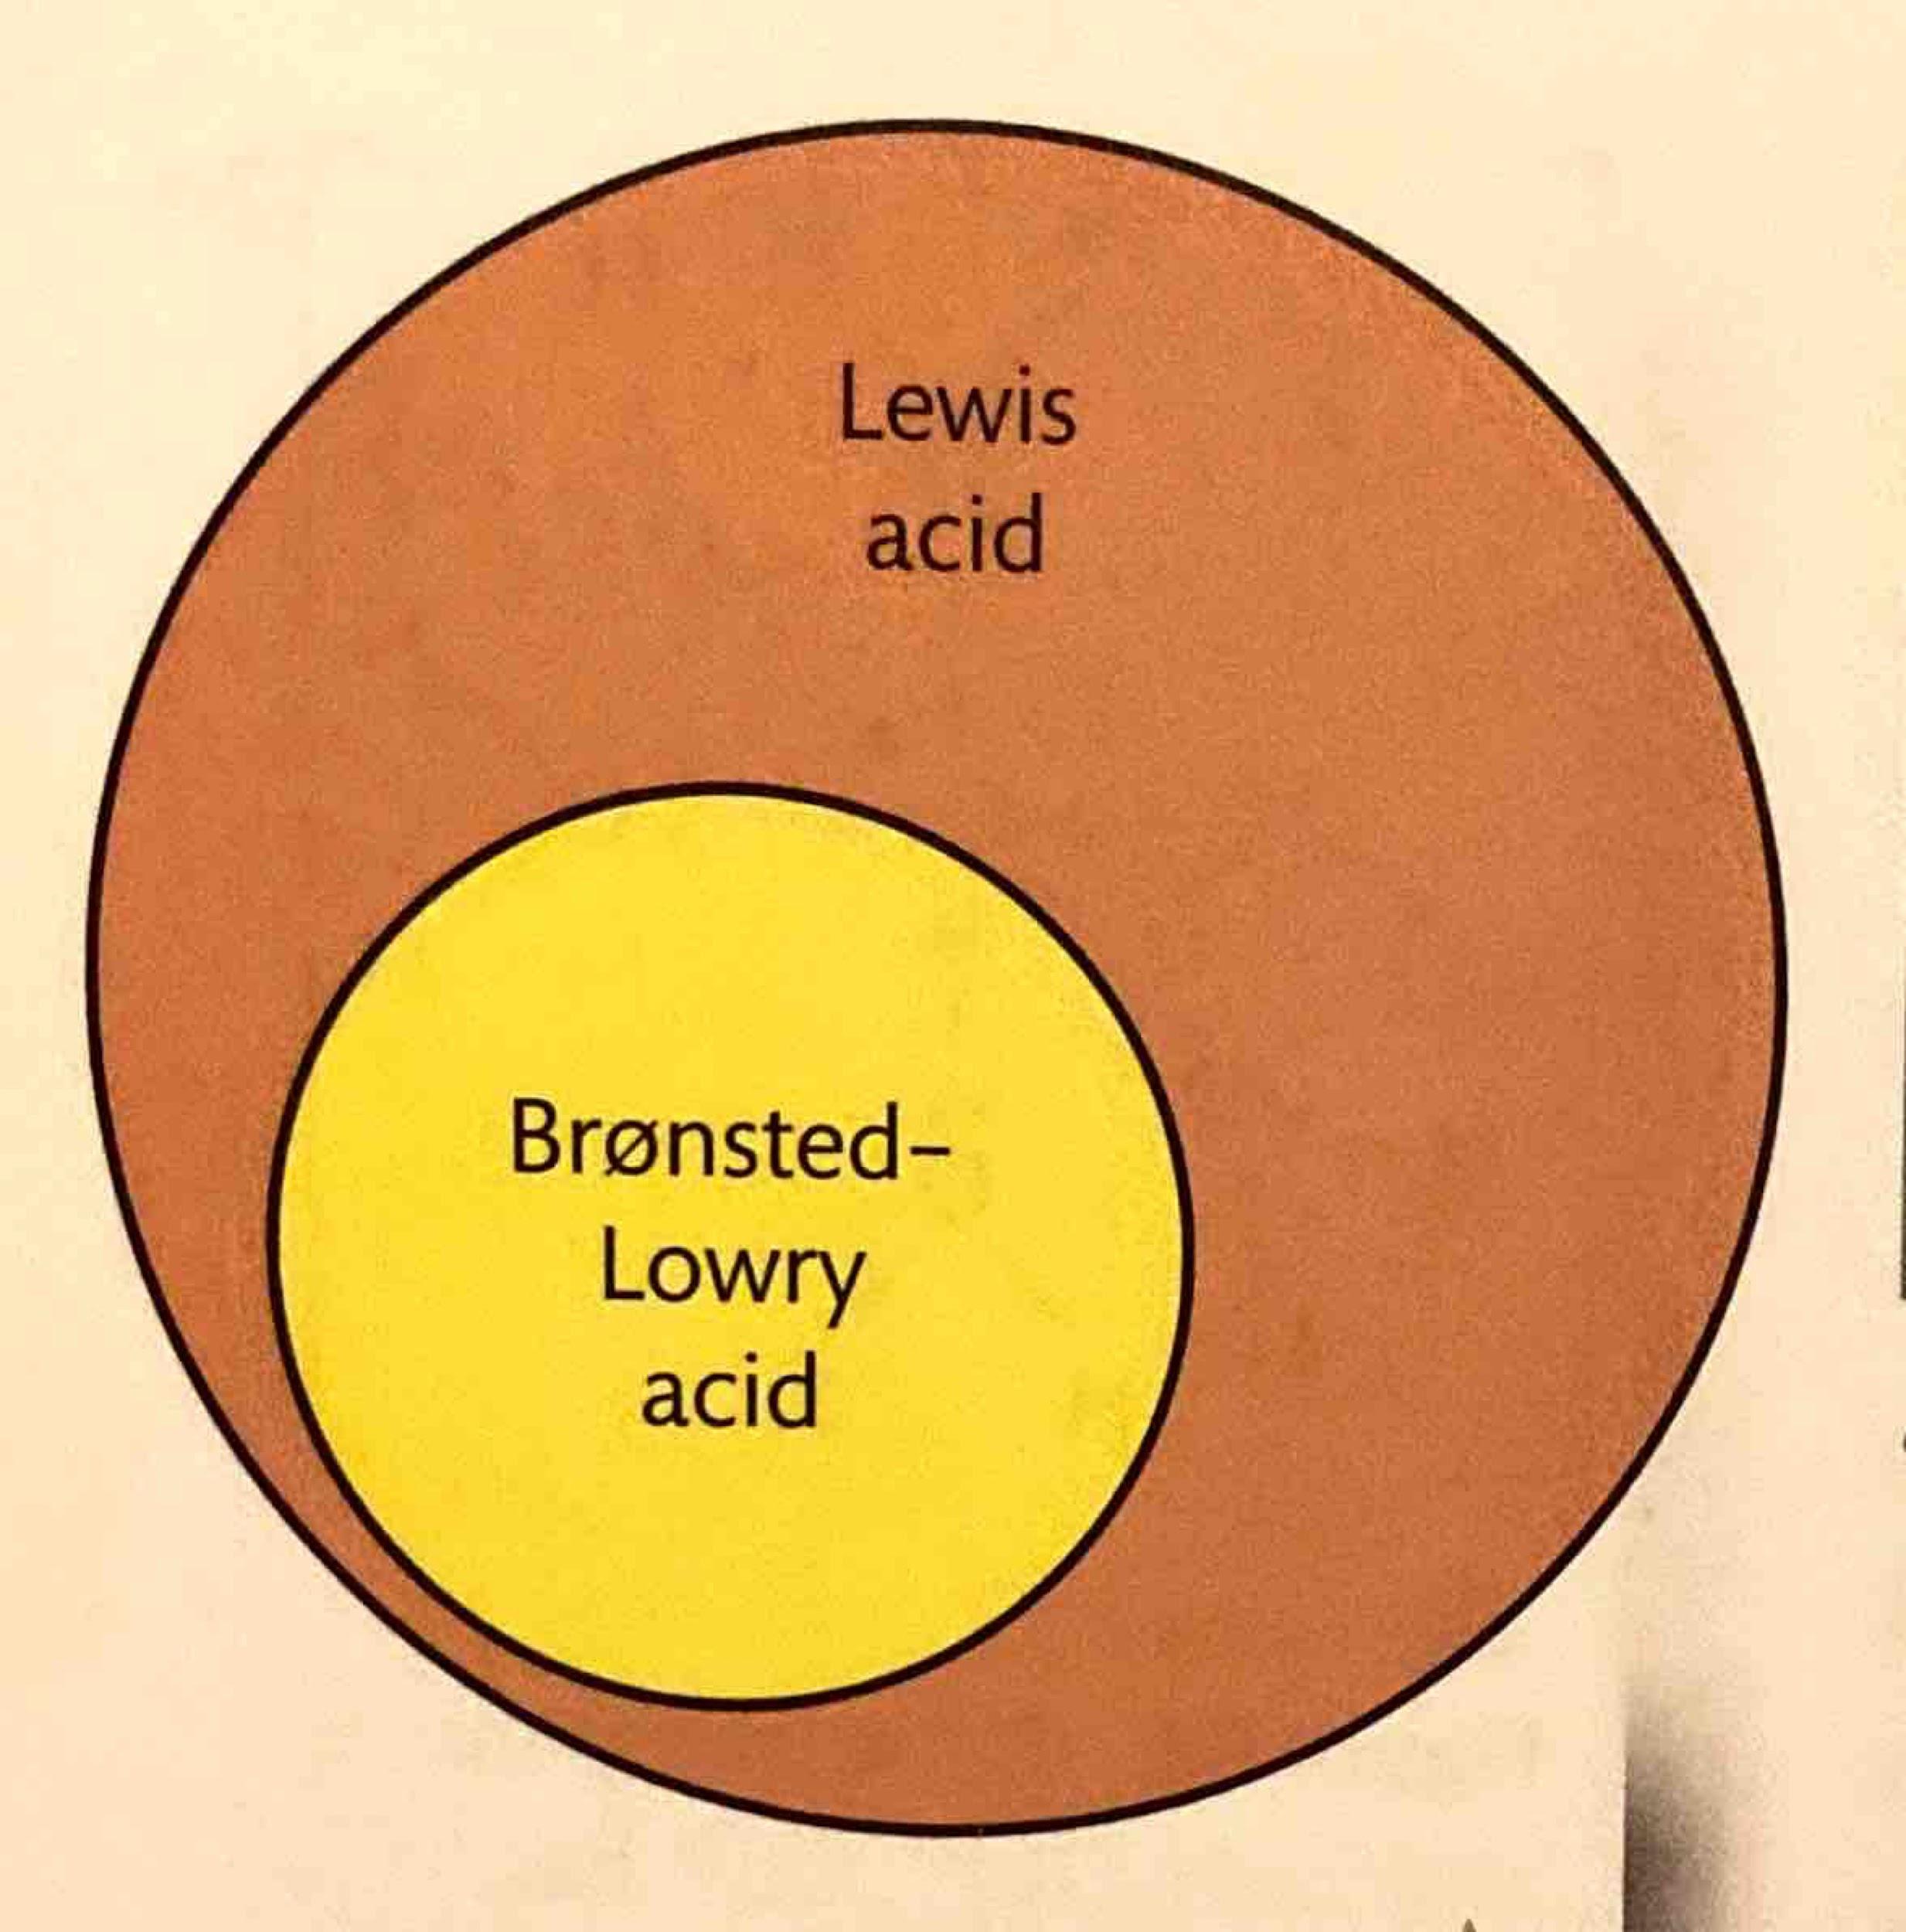
Relationship Between Brønsted-Lowry and Lewis Theories

It is important to note that all Brønsted-Lowry acids are also Lewis acids, as a proton donor (Brønsted-Lowry acid) can accept an electron pair. However, not all Lewis acids are Brønsted-Lowry acids, as Lewis acids encompass a broader range of electron-pair acceptors that may not necessarily donate a proton. Similarly, Lewis bases are electron-pair donors. Some substances, like aluminum oxide (Al2O3), can exhibit both acidic and basic properties depending on the reaction environment, making them amphoteric. For example, Al2O3(s) reacts with a strong base like NaOH(aq) to form NaAlO2(aq) and 2H2O(l). While some Lewis acids/bases are amphoteric, they are not necessarily amphiprotic (meaning they don't necessarily donate or accept protons). The following table summarizes the definitions of acids and bases according to Brønsted-Lowry and Lewis theories:
Theory Definition of acid Definition of base
Brønsted-Lowry Proton donor Proton acceptor
Lewis Electron pair acceptor Electron pair donor
Diagram
Diagram
2
Ka and Kb Calculations

Understanding Dissociation Constants

The extent to which a substance ionizes in a solution is quantified by its dissociation constant, which is an equilibrium constant. These constants are particularly useful for describing the ionization of weak acids and bases, as these substances do not dissociate completely in solution. Consequently, the concentrations of ions at equilibrium cannot be directly inferred from their initial concentrations. The magnitude of the dissociation constant provides valuable information about the position of the equilibrium; a higher value indicates greater dissociation and, therefore, a higher concentration of products relative to reactants.

Acid and Base Dissociation Constants

For weak acids, the acid dissociation constant (Ka) serves as a quantitative measure of their dissociation in solution. The general equilibrium for a weak acid, HA, in water is represented as:
HA(aq) + H2O(l) ⇌ H3O+(aq) + A-(aq)
The expression for Ka is given by: Ka = [H3O+][A-] / [HA]
 Similarly, for weak bases, the base dissociation constant (Kb) quantifies their dissociation in solution. The general equilibrium for a weak base, B, in water is:
B(aq) + H2O(l) ⇌ BH+(aq) + OH-(aq)
The expression for Kb is given by: Kb = [BH+][OH-] / [B]
 It is important to note that Ka and Kb values are constant at a specified temperature. A higher Ka value signifies a stronger acid, indicating greater dissociation, while a higher Kb value indicates a stronger base, also implying greater dissociation. Acids that are polyprotic, meaning they can release more than one hydrogen ion, will have multiple Ka values, each corresponding to the dissociation of a successive proton.

Calculations Involving Ka and Kb

When performing calculations involving Ka and Kb, several key points must be considered. Both Ka and Kb can be utilized to determine ion concentrations at equilibrium. The pH and pOH values directly relate to the equilibrium concentrations of H+ and OH- ions, respectively. It is crucial to remember that the given concentration of an acid or base typically refers to its initial concentration before any dissociation occurs. The concentrations used in the Ka and Kb expressions must always be the equilibrium concentrations. For cases where Ka or Kb values are very small, a simplifying assumption can often be made: the initial concentration of the acid or base is approximately equal to its equilibrium concentration. To systematically calculate Ka, Kb, or equilibrium concentrations, ICE (Initial, Change, Equilibrium) tables are an invaluable tool.

Calculating Ka and Kb from pH and Initial Concentration

Let's illustrate how to calculate Ka from the pH and initial concentration of a weak acid. Consider a 0.01 mol dm-3 solution of ethanoic acid (CH3COOH) at 298 K, which has a pH of 3.4. First, we determine the equilibrium concentration of H+ ions from the pH: [H+] at equilibrium = 10-pH = 10-3.4 = 4.0 x 10⁻⁴ mol dm-3 Next, we set up an ICE table for the dissociation of ethanoic acid: CH3COOH(aq) ⇌ CH3COO-(aq) + H+(aq)
CH3COOH CH3COO- H+
Initial 0.01 0.00 0.00
Change -4.0 x 10⁻⁴ +4.0 x 10⁻⁴ +4.0 x 10⁻⁴
Equilibrium 0.01 - 4.0 x 10⁻⁴ 4.0 x 10⁻⁴ 4.0 x 10⁻⁴
Now, we can calculate Ka using the equilibrium concentrations: Ka = [CH3COO-][H+] / [CH3COOH] Ka = (4.0 x 10⁻⁴)2 / (0.01 - 4.0 x 10⁻⁴) Since 4.0 x 10⁻⁴ is much smaller than 0.01, we can approximate 0.01 - 4.0 x 10⁻⁴ ≈ 0.01. Ka ≈ (4.0 x 10⁻⁴)2 / 0.01 Ka ≈ 1.6 x 10⁻⁵

Calculating [H+]/pH or [OH-]/pOH from Ka and Kb

Let's consider how to calculate the pH of a solution given its initial concentration and Ka. For a 0.75 mol dm-3 solution of ethanoic acid with a Ka value of 1.8 x 10⁻⁵ at a specified temperature, we want to find its pH. We set up an ICE table, letting 'x' represent the change in concentration due to dissociation: CH3COOH(aq) ⇌ CH3COO-(aq) + H+(aq)
CH3COOH CH3COO- H+
Initial 0.75 0.00 0.00
Change -x +x +x
Equilibrium 0.75 - x x x
Now, we write the Ka expression: Ka = [CH3COO-][H+] / [CH3COOH] 1.8 x 10-5 = x2 / (0.75 - x)
Since Ka is small, we can assume that x is much smaller than 0.75, so 0.75 - x ≈ 0.75. 1.8 x 10⁻⁵ ≈ x2 / 0.75 x2 = 1.8 x 10-5 * 0.75
x2 = 1.35 x 10⁻⁵ x = √1.35 x 10⁻⁵
x = 3.7 x 10⁻³
Therefore, [H+] = 3.7 x 10⁻³ mol dm-3. Finally, we calculate the pH: pH = -log([H+]) = -log(3.7 x 10⁻³) = 2.4

The pKa and pKb Scales

Similar to how pH and pOH provide a convenient scale for expressing H+ and OH- concentrations, Ka and Kb can be converted into their negative logarithms, known as pKa and pKb, respectively. This transformation simplifies the comparison of acid and base strengths. The relationship is defined as: pKa = -log(Ka) Conversely, Ka = 10-pKa And for bases: pKb = -log(Kb) Conversely, Kb = 10-pKb

Key Characteristics of pKa and pKb

Several important characteristics define pKa and pKb values. Firstly, pKa and pKb numbers are typically positive and are dimensionless. Secondly, there is an inverse relationship between Ka and pKa, and similarly between Kb and pKb; a larger Ka value corresponds to a smaller pKa value, indicating a stronger acid. Thirdly, a change of one unit in pKa or pKb represents a tenfold change in the corresponding Ka or Kb value. Lastly, like Ka and Kb, pKa and pKb values are temperature-dependent and must be quoted at a specific temperature.

Relationship Between Ka/Kb and pKa/pKb for Conjugate Pairs

The relationship between the dissociation constants of a conjugate acid-base pair is fundamental. Consider a weak acid, HA, and its conjugate base, A
Diagram
-. The dissociation of the acid is: HA(aq) ⇌ H+(aq) + A-(aq)
With its acid dissociation constant:
Ka = [H+][A-] / [HA]
The reaction of the conjugate base with water is: A-(aq) + H2O(l) ⇌ HA(aq) + OH-(aq)
With its base dissociation constant: Kb = [HA][OH-] / [A-]
 Multiplying Ka and Kb for a conjugate pair reveals a significant relationship:
Ka × Kb = ([H+][A-] / [HA]) × ([HA][OH-] / [A-])
Ka × Kb = [H+] × [OH-]
This product is equal to the ion product of water, Kw, which is 1.00 x 10⁻¹⁴ at 298 K.
Therefore, Ka × Kb = Kw = 1.00 x 10⁻¹⁴
 Taking the negative logarithm of this equation yields the relationship between pKa and pKb:
-log(Ka × Kb) = -log(Kw) -log(Ka) + (-log(Kb)) = -log(Kw)
pKa + pKb = pKw = 14.00 at 298 K
 This relationship implies that for a conjugate acid-base pair, a higher Ka value for the acid corresponds to a lower Kb value for its conjugate base. In other words, stronger acids have weaker conjugate bases, meaning the equilibrium for the conjugate base's reaction with water lies further to the left.
Diagram
3
Buffers & Salt Hydrolysis

The Nature and Importance of Buffers

A buffer is a solution that resists significant changes in pH when small amounts of acid or alkali are added. This ability to reduce the impact of pH fluctuations is crucial in many contexts. For instance, water, without buffering, is highly susceptible to pH changes, which can have profound effects on chemical reactions occurring within it. In biological systems, buffers are indispensable because enzymes, which catalyze vital biochemical processes, can only function effectively within a narrow pH range. Examples of biological systems that rely on buffers include mammalian blood and the oceans. Beyond biology, buffers are also essential in various chemical processes, such as electrophoresis, fermentation, the dyes industry, and for the calibration of instruments. Different buffer systems can be designed to maintain a stable pH at virtually any desired value.

The Ocean Water Buffer System and Ocean Acidification

The ocean plays a critical role as a carbon dioxide (CO2) sink, absorbing a significant amount of CO2 from the atmosphere. However, as more CO2 is absorbed, it reacts with water to form carbonic acid, which then dissociates, releasing hydrogen ions (H+) and making the water more acidic. This increase in H+ ions shifts the equilibrium of the carbonate buffer system, leading to a reduction in carbonate (CO32-) levels. This phenomenon, known as ocean acidification, has severe consequences, including the decline of coral reefs due to the decreased availability of carbonate ions needed for calcification. Furthermore, the decreasing water pH reduces the ocean's buffering capacity, thereby diminishing its ability to absorb atmospheric CO2 effectively. The primary equilibrium involved in this buffering system is:

CO32- ﹢ H+ ⇌ HCO3-

Diagram

Mechanism of Buffer Action

Buffers are categorized based on the pH range they maintain: acidic buffers keep the pH below 7, while basic buffers maintain a pH above 7. A buffer solution is typically formed by mixing a weak acid with a solution of its conjugate base, or a weak base with a solution of its conjugate acid. The presence of both the weak acid/base and its conjugate allows the buffer to neutralize added H+ or OH- ions, thereby resisting pH changes.

Diagram

Acidic Buffer Systems

An excellent example of an acidic buffer is a solution containing ethanoic acid (CH3COOH) and sodium ethanoate (NaCH3COO). When sodium ethanoate dissolves in water, it fully dissociates to produce ethanoate ions (CH3COO-) and sodium ions (Na+):

NaCH3COO(aq) → CH3COO- ﹢ Na+(aq)

Ethanoic acid is a weak acid, meaning it only partially dissociates in water, establishing an equilibrium:

CH3COOH(aq) ⇌ CH3COO- ﹢ H+(aq)

Due to the weak nature of ethanoic acid, this equilibrium lies predominantly to the left. The resulting mixture contains high concentrations of both the weak acid (CH3COOH) and its conjugate base (CH3COO-). When an acid (H+) is added, the ethanoate ions react with it, forming more undissociated ethanoic acid. Conversely, when a base (OH-) is added, the ethanoic acid neutralizes it, forming water and ethanoate ions. These neutralization reactions allow the buffer to absorb added H+ or OH-, thus maintaining a stable pH.

Diagram

Basic Buffer Systems

A common basic buffer system involves ammonia (NH3) and ammonium chloride (NH4Cl). When ammonium chloride dissolves, it fully dissociates into ammonium ions (NH4+) and chloride ions (Cl-):

NH4Cl(aq) → NH4+(aq) ﹢ Cl-(aq)

Ammonia is a weak base, and its reaction with water establishes an equilibrium:

NH3(aq) + H2O(l) ⇌ NH4+(aq) ﹢ OH-(aq)

Similar to acidic buffers, this equilibrium lies to the left because ammonia is a weak base. The buffer solution therefore contains high concentrations of both the weak base (NH3) and its conjugate acid (NH4+). If an acid (H+) is added, the ammonia molecules react with it to form ammonium ions. If a base (OH-) is added, the ammonium ions react with it to form ammonia and water. These neutralization reactions prevent significant changes in pH.

The components of a basic buffer are:
    • Weak base: NH3
    • Conjugate acid: NH4+
    • Reacts with H3O+ (from added acid)
    • Reacts with OH- (from added base)
    • Forms H2O

Preparation of Buffer Solutions

To prepare a buffer solution, one typically starts with an acid or base that has a pKa or pKb value close to the desired pH or pOH of the final buffer. This weak acid or base is then mixed with a solution containing its conjugate salt. Alternatively, a portion of the weak acid or base can be partially neutralized with a strong base or strong acid, respectively. This partial neutralization ensures that approximately half of the starting acid or base is converted into its conjugate salt. The final mixture will then contain significant and comparable amounts of both the weak acid/base and its conjugate salt, which is essential for effective buffering. The pH of the resulting buffer solution is determined by two main factors: the pKa or pKb of the weak acid or base used, and the ratio of the initial concentrations of the weak acid/base to its conjugate salt.

Factors Influencing Buffer Performance

Two primary factors can influence the characteristics of a buffer solution: dilution and temperature.

  • Dilution: While dilution does not alter the acid dissociation constant (Ka) or base dissociation constant (Kb) of the components, nor does it change the pH of the buffer (because the ratio of the acid/base to its conjugate salt remains constant), it does affect the buffer's capacity. Buffering capacity refers to the amount of acid or base a buffer can absorb without a significant change in pH. A more dilute buffer will have a lower buffering capacity.
  • Temperature: Temperature, unlike dilution, does affect the Ka and Kb values of weak acids and bases. Consequently, changes in temperature will also lead to changes in the pH of a buffer solution.

Understanding Salt Hydrolysis

Salts, formed from the reaction of an acid and a base, can themselves be acidic, basic, or neutral when dissolved in water. The pH of a salt solution depends on the extent to which the ions (which are conjugate acids or bases) derived from the salt can react with water (hydrolyze) to produce H+ or OH- ions. The strength of these conjugate acids and bases determines the degree of hydrolysis and, consequently, the pH of the solution. The general reaction for salt formation is:

MOH (Parent base) ﹢ HA (Parent acid) → M+A- (Salt) ﹢ H2O

There are four main types of salts based on the strength of their parent acid and base:

  • Salt of a weak acid and a strong base: The anion hydrolyzes, making the solution basic.
  • Salt of a strong acid and a weak base: The cation hydrolyzes, making the solution acidic.
  • Salt of a weak acid and a weak base: The pH depends on the relative strengths (Ka and Kb values) of the weak acid and weak base.
  • Salt of a strong acid and a strong base: Neither ion hydrolyzes significantly, resulting in a neutral solution.

Specific Examples of Salt Hydrolysis

Salt of a Strong Acid and a Weak Base: Cation Hydrolysis (Acidic)

When a salt formed from a strong acid and a weak base dissolves in water, the cation, which is the conjugate acid of the weak base, can hydrolyze water. For example, with ammonium chloride (NH4Cl), the ammonium ion (NH4+) reacts with water:

M+(aq) ﹢ H2O(l) ⇌ MOH(aq) ﹢ H+(aq)

NH4+(aq) ﹢ H2O(l) ⇌ NH4OH(aq) ﹢ H+(aq)

The release of H+ ions into the solution causes the pH to decrease, making the solution acidic (pH < 7 at 298 K). Similarly, metal cations with high charge densities, such as Al3+ and Fe3+, can also hydrolyze water to produce acidic solutions.

Salt of a Weak Acid and a Strong Base: Anion Hydrolysis (Basic)

In the case of a salt derived from a weak acid and a strong base, the anion, which is the conjugate base of the weak acid, hydrolyzes water. For instance, with sodium ethanoate (CH3COONa), the ethanoate ion (CH3COO-) reacts with water:

A-(aq) ﹢ H2O(l) ⇌ HA(aq) ﹢ OH-(aq)

CH3COO-(aq) ﹢ H2O(l) ⇌ CH3COOH(aq) ﹢ OH-(aq)

The production of OH- ions increases the pH of the solution, making it basic (pH > 7 at 298 K).

Salt of a Weak Acid and a Weak Base

When a salt is formed from the reaction of a weak acid and a weak base, both the cation (conjugate acid of the weak base) and the anion (conjugate base of the weak acid) can hydrolyze water. In such cases, the pH of the resulting solution depends on the relative strengths of the weak acid and weak base, specifically their Ka and Kb values. If Ka > Kb, the solution will be acidic; if Kb > Ka, the solution will be basic; and if Ka ≈ Kb, the solution will be approximately neutral.

Summary of Salt Hydrolysis Effects on pH

Diagram
4
Titration Curves & Indicators

The Fundamentals of Acid/Base Titrations

Acid/base titrations are analytical techniques used to determine the concentration of an unknown acid or base. This process involves the controlled addition of a reactant, typically from a burette, into a fixed volume of the other reactant, usually contained in an Erlenmeyer flask. The reaction proceeds until the equivalence point, also known as the stoichiometric point, is reached, signifying complete neutralization. It is crucial to understand that the change in pH during a titration is not linear. Instead, a pH curve is generated by plotting the pH values against the volume of the reactant added. A characteristic feature of these curves is a large, sharp jump in pH, known as the inflection point. The equivalence point is located precisely at the midpoint of this steep pH change. The final pH of the neutralized solution is influenced by the hydrolysis of ions present in the salt formed during the reaction.

For illustrative purposes in example problems, we will make the following assumptions:

  • All acid and base solutions have a concentration of 0.10 mol dm-3.
  • The initial volume of the acid in the Erlenmeyer flask is 50.0 cm3, with the base being added from the burette.
  • Acids and bases react in a 1:1 stoichiometric ratio, meaning equivalence is achieved when equal volumes of base have been added to the acid.
Diagram

Titration Curve Characteristics for Strong Acid/Strong Base Reactions

When a strong acid is titrated with a strong base, the pH curve exhibits distinct features. Initially, the pH is very low, typically around 1, due to the high concentration of H+ ions from the strong acid. As the strong base is gradually added, the pH changes slowly until it approaches the equivalence point. At this point, there is a sharp and significant jump in pH, spanning a wide range, typically from pH 3 to pH 11. This dramatic change indicates that stoichiometrically equal amounts of acid and base have neutralized each other, as exemplified by the reaction: HCl(aq) + NaOH(aq) → NaCl(aq) + H2O(l). After the equivalence point, the curve flattens out again as excess strong base is added, and the pH stabilizes at a high value. Crucially, the pH at the equivalence point for a strong acid-strong base titration is exactly 7, indicating a neutral solution.

Diagram

Titration Curve Characteristics for Weak Acid/Strong Base Reactions

Titrations involving a weak acid and a strong base present a different pH curve profile. The initial pH is comparatively higher than that of a strong acid, reflecting the partial dissociation of the weak acid. As the strong base is added, the pH remains relatively constant for a period, forming a buffer region, until the equivalence point is approached. At equivalence, a jump in pH occurs, but it is generally less extensive than in strong acid-strong base titrations, typically ranging from pH 7.0 to 11.0. The reaction can be represented as: CH3COOH(aq) + NaOH(aq) ⇌ NaCH3COO(aq) + H2O(l).
A key characteristic of this titration is that the pH at the equivalence point is greater than 7.0, due to the hydrolysis of the conjugate base (CH3COO-) formed. After the equivalence point, the curve flattens as excess strong base is added. An important point on this curve is the half-equivalence point, where half of the weak acid has been neutralized, and the pH is equal to the pKa of the weak acid.

Diagram

Titration Curve Characteristics for Strong Acid/Weak Base Reactions

In a titration of a strong acid with a weak base, the initial pH is low, typically around 1, similar to a strong acid-strong base titration. As the weak base is added, the pH gradually increases, forming a buffer region. The jump in pH at the equivalence point is observed, but it occurs in a lower pH range, typically from pH 3.0 to 7.0. The reaction can be represented as: HCl(aq) + NH3(aq) ⇌ NH4Cl(aq). A distinguishing feature of this titration is that the pH at the equivalence point is less than 7.0, due to the hydrolysis of the conjugate acid (NH4+) formed. After the equivalence point, the curve flattens out at a relatively low pH, characteristic of the weak base in excess.

Diagram

Titration Curve Characteristics for Weak Acid/Weak Base Reactions

Titrations involving a weak acid and a weak base exhibit a unique pH curve. The initial pH is relatively high, reflecting the weak acidity. As the weak base is added, the pH rises steadily, but the change in pH at the equivalence point is significantly less sharp and pronounced compared to other titration types. The reaction is represented by:
CH3COOH(aq) + NH3(aq) ⇌ NH4CH3COO(aq).
A critical aspect of this titration is the absence of a clearly defined equivalence point, making it challenging to determine precisely. After the equivalence point, the curve flattens at a fairly low pH, characteristic of the weak base in excess.

Diagram

The Role of Indicators in Titrations

Indicators are crucial components in titrations, signaling a change in pH by undergoing a distinct color change. These substances are typically weak acids or weak bases themselves, existing in two forms: an undissociated form and a dissociated form, each possessing a different color. The color change occurs at the end-point of the titration, which is the pH at which the indicator's pKa value is approximately equal to the pH of the solution. Different indicators have varying pKa values, and consequently, different end-points. A comprehensive list of indicator end-points can be found in Section 22 of the Data Booklet.

Consider a weak acid indicator, HIn, which establishes an equilibrium in solution:

HIn(aq) ⇌ H+(aq) + In-(aq)

Here, HIn represents the undissociated form (one color) and In- represents the dissociated form (another color). According to Le Chatelier's principle:
    • Increasing the concentration of H+ ions (making the solution more acidic) shifts the equilibrium to the         left, favoring the undissociated form.
    • Decreasing the concentration of H+ ions (making the solution more basic) shifts the equilibrium to the         right, favoring the dissociated form.

The acid dissociation constant (Ka) for the indicator is given by:

Ka = [H+][In-] / [HIn]

At the indicator's equilibrium, when the color change is most apparent, the concentrations of the undissociated and dissociated forms are approximately equal, meaning [In-] ≈ [HIn]. Under this condition, the Ka expression simplifies to Ka ≈ [H+], which implies that pKa ≈ pH. This relationship highlights why an indicator's pKa is directly related to the pH at which its color change occurs.

Diagram

Selecting the Appropriate Indicator for a Titration

The effective use of an indicator in a titration hinges on selecting one whose pKa value is close to the pH of the equivalence point of the acid/base reaction being performed. Indicators serve to signal the equivalence point, but it is important to distinguish between the equivalence point (the theoretical point of complete neutralization) and the end point (the pH at which the indicator's color change is observed). For an accurate titration, these two points should coincide as closely as possible.

Diagram

Guidelines for Indicator Selection

To choose the most suitable indicator for a titration, follow these steps:

  1. Identify the Reactant Types: Determine whether the titration involves a strong acid/strong base, weak acid/strong base, strong acid/weak base, or weak acid/weak base combination. This classification is crucial because it dictates the pH at the equivalence point.
  2. Determine the Equivalence Point pH: Based on the types of acid and base reacting, deduce the pH of the salt solution at the equivalence point. For example, a strong acid/strong base titration has an equivalence point at pH 7, while a weak acid/strong base titration will have an equivalence point above pH 7.
  3. Match Indicator End-Point to Equivalence Point: Select an indicator whose end-point (the pH range over which its color changes) falls within the steep pH change region of the titration curve, ideally encompassing the equivalence point. This ensures that the indicator changes color precisely when neutralization is complete.
Diagram